The main stages of developing a cognitive model of a problem situation. Medium-term forecasting of the Russian economy using a cognitive model
The cognitive approach to the study of complex systems, such as socio-economic, political, etc., a number of related concepts, as well as the methodology and technology of cognitive modeling of complex systems are considered.
Mathematical representation of cognitive models
The beginning of research related to the use of the cognitive approach for studying, modeling, and decision-making in the field of complex systems dates back to the middle of the 20th century, when the ideas of cognitive psychology began to be applied in various fields of knowledge and a system of disciplinary research called “cognitive science” began to take shape ( English cognitive science). Its main areas are philosophy, psychology, neurophysiology, linguistics, and artificial intelligence. Currently, there is an expansion of subject areas in which the cognitive approach is used. The active use of the cognitive approach in the study of complex systems in our country began in the 1990s; the center of the research was the Institute of Computer Science of the Russian Academy of Sciences. This section presents a number of results of cognitive studies of complex systems conducted at the Southern Federal University, the source of which can be considered the work of R. Axelrod, F. Roberts, J. Cast, R. Etkin, as well as employees of the Institute of Computer Science of the Russian Academy of Sciences (V. I. Maksimov, V.V. Kulba, N.A. Abramov, etc.).
To understand the meaning of cognitive research, their directions, models and methods, it is necessary to know a number of special terms, such as: cognitive science and cognitive science, cognitive science (knowledge engineering), cognitive approach (cognitive), technology of cognitive (cognitive-target) modeling, visualization, cognitive modeling, cognitive structuring or conceptualization, cognitive modeling methodology, cognitive model, cognitive map. Definitions of these concepts (and a number of others related to cognitive sciences) can be found in the works. Cognitive maps have not only a visual, but also a mathematical basis. These are clear and fuzzy graphs (fuzzy cognitive maps).
The graph turns out to be a suitable model for representing the relationships between economic objects (enterprises, organizations, means and factors of production, elements of the social sphere, characterized as an object in which economic activity is concentrated or directed, and representing a certain side of economic relations), between subjects of social processes (for example, people, groups of people), between subsystems of socio-economic systems, between other concepts, entities, etc. Let's use the definition of F. Roberts: “A signed graph (signed digraph) is a graph in which “... the vertices correspond to members of the group; from the top V-, an arc is drawn to the vertex if a clearly expressed V;K V ratio is observed, and the arc vd = (V, V]) has a plus sign (+) if V,"likes" U^i minus sign (-) otherwise."
The concept of a "signed digraph" can have a variety of applications, so arcs and signs are interpreted differently depending on the complex system being studied. In addition, theoretical studies of complex systems are being developed within the framework of a more complex model than a signed digraph - within the framework of a weighted digraph, in which each arc ec assigned real number (weight) huts.
An example of a cognitive map is shown in Fig. 6.12 (the figure was made using the PSKM^ software system). Solid arc lines correspond to Shts= +1, dash-dotted - = -1. The sign can be interpreted as “positive (negative) changes at vertex r lead to positive (negative) changes at vertex yu,” i.e. these are unidirectional changes; sign "-" - as in "positive (negative) changes in the vertex lead to negative (positive) changes in the vertex Vj" - multidirectional changes. Counter arrows display the mutual influence of vertices, the cycle of the graph; this relationship is symmetrical. Most of the concepts of digraphs also apply to weighted digraphs. These concepts are: path, simple path, half-path, contour, cycle, half-circuit; strong, weak, one-way connectivity, “sign of a path, closed path, contour.”
Sign of path, circuit, closed path, closed circuit, loop outline, etc. is defined as the product of the signs of the arcs included in them.
Obviously, a path, a cycle, etc. have a sign if the number of negative arcs they contain is odd, otherwise they have a "+" sign. So, for the graph "Romeo and Juliet" the path is V,-" V, -" U -> V, is negative, and the cycle Uh -> Uh-> V, - positive.
Rice. 6.12. arc go= +1 and Shts = -1
When mathematically modeling complex systems, the researcher faces the problem of finding a compromise between the accuracy of the modeling results and the ability to obtain accurate and detailed information to build the model. In such a situation, signed and weighted digraphs are suitable for developing “simple” mathematical models and for analyzing results obtained with minimal information.
Let us give two more examples from [Hobesh, With. 161, 162] - fig. 6.13 and 6.14, interesting from a historical point of view as one of the first cognitive maps, but which have not lost their relevance now.
In Fig. 6.14 circuit Wow-> U - > U$ -> U6 -" Wow counteracts the deviation at the vertex V,. If you increase/decrease any variable in this circuit, then these changes lead through other vertices to a decrease/increase in this variable (interpretation: the larger the population, the more waste, the more bacteria, the greater the incidence - the greater the incidence, the fewer people, and so on.). This is a negative feedback loop. Circuit V, -> U ->UA -> V is a contour that enhances the deviation, i.e. positive feedback loop.

Rice. 6.13.
We will use the following in the future Maruyama's statement:"A contour enhances deflection if and only if it contains an even number of negative arcs (otherwise it is a contour that counteracts deflection)."
The diagram (Fig. 6.14) contains a small number of vertices and connections for the convenience of preliminary analysis. A more thorough analysis of the problem of energy consumption will require, according to Roberts, a significantly larger number of variables and more nuanced methods for selecting them. This raises the problem of combining expert opinions.
To solve the problems outlined in the examples in Fig. 6.13 and 6.14, it is not enough just to construct a graph of one or another complexity and analyze the chains of its connections (paths) and cycles; a deeper analysis of its structure, stability properties (instability), analysis of the impact of changes in vertex parameters on other vertices, and sensitivity analysis are required.

Rice. 6.14.(Roberts, With. 162)
In order to understand and analyze the behavior of a complex system, a structural diagram of cause-and-effect relationships is built. Such schemas that interpret the opinions and views of the decision maker are called a cognitive map.
The term "cognitive map" was coined by psychologist Tolman in 1948. A cognitive map is a type of mathematical model that allows you to formalize the description of a complex object, problem or system functioning and identify the structures of cause-and-effect relationships between the elements of the system, a complex object, the components of the problem and assess the consequences as a result of influencing these elements or changing the nature of the connections. The English scientist K. Ideas proposed the use of cognitive maps for collective decision-making and decision-making.
Cognitive map of the situation is an oriented graph, the nodes of which represent some objects (concepts), and the arcs are connections between them, characterizing cause-and-effect relationships.
Model development begins with the construction of a cognitive map that reflects the situation “as is.” Based on the generated cognitive map, self-development of the situation is modeled in order to identify positive trends in development. “Self-development” allows you to compare subjective expectations with model ones.
The main concept in this approach is the concept of “situation”. The situation is characterized by a set of so-called basic factors, with the help of which the processes of changing states in a situation are described. Factors can influence each other, and such influence can be positive, when an increase (decrease) in one factor leads to an increase (decrease) in another factor, and negative, when an increase (decrease) in one factor leads to a decrease (increase) in another factor.
The interaction matrix presents the weights of only direct influences between factors. The rows and columns of the matrix are associated with the factors of the cognitive map, and the signed value at the intersection of the i-th row and the j-ro column indicates the weight and direction of influence of the i-ro factor on the j-th factor. To display the degree (weight) of influence, a set of linguistic variables such as “strong”, “moderate”, “weak”, etc. is used; Such a set of linguistic variables is compared with numerical values from the interval: 0.1 - “very weak”; 0.3 - “moderate”; 0.5 - “significant”; 0.7 - “strong”; 1.0 - “very strong”. The direction of influence is given by the sign: positive, when an increase (decrease) in one factor leads to an increase (decrease) in another factor, and negative, when an increase (decrease) in one factor leads to a decrease (increase) in another factor.
Identifying initial trends
Initial trends are set by linguistic variables like
“strong”, “moderate”, “weak”, etc.; To such a set of linguistic variables, numerical values from the interval are compared. If a trend is not specified for a factor, this means that either no noticeable changes are visible in the factor in question, or there is not enough information to assess the existing trend for it. When modeling, it is assumed that the value of this factor is 0 (i.e., it does not change).
Identification of target factors
Among all the selected factors, it is necessary to determine the target and control factors. Target factors are factors whose dynamics need to be brought closer to the required values. Ensuring the required dynamics of target factors is the solution that is pursued when constructing a cognitive model.
Cognitive maps can be used for a qualitative assessment of the influence of individual concepts on each other and on the stability of the system as a whole, for modeling and evaluating the use of various strategies in decision making and forecasting decisions made.
It should be noted that the cognitive map reflects only the fact of the influence of factors on each other. It does not reflect the detailed nature of these influences, nor the dynamics of changes in influences depending on changes in the situation, nor temporary changes in the factors themselves. Taking into account all these circumstances requires moving to the next level of structuring the information displayed in the cognitive map, that is, the cognitive model. At this level, each relationship between the factors of the cognitive map is expanded into a corresponding equation, which can contain both quantitative (measurable) variables and qualitative (non-measured) variables. In this case, quantitative variables are included naturally in the form of their numerical values, since each qualitative variable is associated with a set of linguistic variables, and each linguistic variable corresponds to a certain numerical equivalent on the scale [-1,1]. As knowledge accumulates about the processes occurring in the situation under study, it becomes possible to reveal in more detail the nature of the connections between factors.
There are mathematical interpretations of cognitive maps, for example, soft mathematical models (the famous Lotka-Volterra model of the struggle for existence). Using mathematical methods, one can predict the development of the situation and analyze the stability of the resulting solution. There are two approaches to constructing cognitive maps - procedural and process. A procedure is a discrete time effect that has a measurable result. Mathematics made significant use of discreteness, even if we measured in linguistic variables. The process approach speaks more about maintaining processes; it is characterized by the concepts of “improving”, “activating”, without reference to measurable results. The cognitive map of this approach has an almost trivial structure - there is a target process and surrounding processes that have a positive or negative impact on it.
There are two types of cognitive maps: traditional and fuzzy. Traditional maps are specified in the form of a directed graph and represent the modeled system in the form of a set of concepts that display its objects or attributes, interconnected by cause-and-effect relationships. They are used to qualitatively assess the impact of individual concepts on system stability.
In order to expand the capabilities of cognitive modeling, a number of works use fuzzy cognitive maps. In a fuzzy cognitive map, each arc determines not only the direction and nature, but also the degree of influence of the associated concepts.
Cognitive models. Cognitive structuring begins with identifying objects (characterized both quantitatively and qualitatively, verbally) of the system being studied for a specific purpose and establishing connections between them. These actions are carried out with the help of experts, by
Rice. 6.16.
collection and processing of statistical information, based on the study of literature data, they are based on theoretical knowledge in the relevant subject area.
As a result of cognitive structuring, a formal description of knowledge is developed, which can be visually represented by a cognitive model (in the form of a diagram, graph, matrix, table or text). Development of a cognitive model is the most creative and poorly formalized stage in the activity of a researcher (group of experts) of a large system. Partial formalization is possible when processing numerical data in the form of statistical information through the use of data mining tools (for example, Data mining). Sources of information for determining “high-quality” vertices can be theoretical information in the subject area being studied and agreed decisions of a group of experts. In the latter case, a “collective cognitive map” is developed.
Attention should be paid to the need for the “correct” name of the peak - poorly chosen names (concepts) distort the results of the study and may not give answers to the questions to which it would be desirable to obtain answers.
So, the result of the process of identifying a complex system at the first stage of the study is a cognitive map G, which can be considered as “initial” or “starting”. Whether it remains unchanged, as final, or not, the decision depends on the expert after all stages of cognitive modeling.
Cognitive modeling technology uses different types of cognitive models.
The most commonly used are: a cognitive map (an informal cognitive map, research begins with its development), as well as a weighted signed digraph, a simple functional graph, a parametric vector functional graph, and a modified graph.
Cognitive map(in the original understanding - a diagram of cause-and-effect relationships in a system) is a structural diagram of relations between objects ("concepts", "entities", elements, subsystems) of a complex system; is built in order to understand and analyze its structure and behavior.
From a formal point of view, a cognitive map is a signed oriented graph (digraph), which reflects the pattern of relationships between the objects being studied - the vertices. The relationship between them (the interaction of factors) is a quantitative or qualitative description of the impact of a change in one vertex on others:
Where V- set of vertices, vertices ("concepts") V,- e V,¿=1.2, To are elements of the system being studied; E - set of arcs, arcs e E, I,) =1,2, P reflect the relationship between the vertices of U; and Mu The influence of Mr. b) in the situation under study can be positive ("+" sign), when an increase (decrease) in one factor leads to an increase (decrease) in another, negative ("-" sign), when an increase (decrease) in one factor leads to a decrease (increase) in another , or absent (0). In the latter case, the corresponding arc could be excluded when analyzing a given situation, but it may have significance in another situation. Therefore, if such a possibility is assumed, the arc must be left.
In addition to a graphic image, a cognitive map can be represented by a matrix of relationships Ace:
The matrix А(; is a square matrix, the rows and columns of which are marked by the vertices of the graph WITH and at the intersection of the r-row and the r-column there are ones (or 0) if there is (does not exist) a relationship between the elements V; And Ooh In a cognitive map, a relationship can have a "+1" or "-1" sign.
The cognitive map reflects only the fact that the vertices (factors) influence each other. It does not reflect the detailed nature of these influences, nor the dynamics of changes in influences depending on changes in the situation, nor temporary changes in the factors themselves. Taking into account all these circumstances requires moving to the next level of structuring the information displayed in the cognitive map, i.e. a transition to other types of cognitive model is required.
At the level of the cognitive model, each relationship between the factors of the cognitive map is expanded into a corresponding equation, which can contain both quantitative (measurable) variables and qualitative (non-measurable) variables. Quantitative variables enter the model in the form of their numerical values. Each qualitative variable can be associated with a set of linguistic variables that display different systems of this qualitative variable on a scale.
As knowledge about the processes in the system accumulates, it becomes possible to reveal in more detail the nature of the connections between the vertices - factors (for example, using procedures data mining, if there are tables of statistical data).
A cognitive model such as a vector functional graph is a tuple
Where C =< V, Е> - directed graph; X- many vertex parameters V; X = [ХШ, 1=1,2,.... k, X( u> = (^), e = 1, 2, sch, those. each vertex is assigned a vector of parameters independent from each other X(y"(or one parameter x№>8=X, If g= 1); X: V -> I, I - set of real numbers; P= E(X, E) = Dd:;, Xp e$) - arc transformation functionality that assigns each arc either a sign ("+", "-") or a weighting coefficient<о^, либо функцию damn) =and
Depending on the E(X, E) the extended concept of a digraph is introduced.
1. Cognitive map (sign digraph) as a special case of an Φ-graph in which

where co^- is the weighting coefficient; co^ e. IV, V/ - the set of arc weight coefficients is the set of real numbers. The assessment of co- can be determined by a single number or be interval.
3. The simplest functional graph is is an F-graph in which E= DH, E)=/(i$, Xp e$ =/)/.

where /y is the functional dependence of the parameters of the vertices, which is assigned to each arc. Addiction /y can be not only functional, but also stochastic. Defining Characteristic Parameters /y includes: definition of scale, indicators, method, accuracy, unit of measurement.
The definition of Φ-graphs can be generalized as follows.
4. Parametric vector function graph Fp is a tuple
where b =< V, E > - directed graph; X:V -" 0, X- many vertex parameters, X= (->№> | X<г"> e X, i = 1,
2, To), X("";> = (.g*,0), g 1,2.....to x^- £-parameter of the vertex
Y;, if £= 1, then l-*,"* = x,-; 0 is the space of vertex parameters; /r= E(X, E) - arc transformation functionality, E.Ex. X X x 0 -> TO
5. Modified MF graphs. To reflect the dynamics of changes occurring in the system under the influence of various disturbances, time is introduced into the model. Such graphs are proposed in the work.
Hierarchical cognitive maps . Complex systems are characterized by a pattern of hierarchy. To reflect such a structure, hierarchical cognitive maps can be used - a relatively new type of cognitive models. Hierarchical cognitive maps represent the disclosure of generalized objects (vertices) of the upper level of a cognitive map into their constituent objects, including objects of lower levels. The number of hierarchical levels can be determined both by the number of vertices “revealed” in cognitive maps and by the existing object management system (for example, levels of a state, region, municipality). Figure 6.17 illustrates this idea.

Rice. 6.17.
The hierarchical cognitive map model has the form
where and are cognitive maps To- and (&-1) levels, respectively, Ek = (etKr))- relationships between vertices To- and p-levels.
A ^-level cognitive map is a directed graph
where Y(£) = (r;D£)|r;D&) У(Ш,1 1,2р... и) - set of vertices
^-level, E(k) =|е0"(£)|е$"(£) £(<£); I,./" 1,я} - отношения, отражающие взаимосвязь между вершинами внутри уровня (^-уровня).
The structural unification of a hierarchical cognitive model in the form of a functional graph will have the form
Where Yu h bd., VK, BC 2 - cognitive hierarchical map
that; Xk = X(k)- set of parameters of the vertices of the hierarchical cognitive map; ^ = (?(X,£^);u^(*)) - functional 1=1 transformation of arcs in the hierarchical cognitive model.
One can imagine several interacting objects operating in a certain environment. In this case, it is necessary to build cognitive models of a more complex type - models of interaction between hierarchies, the relationships between which are specified by the rules of game theory. Thus, hierarchies can be in relationships of cooperation (cooperation, coalition) or confrontation (competition). A generalization is possible to the case of interaction between N parties - the general model is a system of hierarchical cognitive models in which the rules of interaction and rules for changing the structure of cognitive models are specified.
Dynamic cognitive maps. Based on the results of research in the field of interaction of complex systems, cognitive models were used in the form of dynamic cognitive maps, in which the model parameters depended on time and took into account temporary changes in the environment.
Problems of analyzing paths and cycles of a cognitive model
The solution to the problem of analyzing paths and cycles of a cognitive model is carried out using traditional methods of graph theory. Identification of paths of various given lengths allows us to trace and interpret chains of cause-and-effect relationships, identifying their features and contradictions. Identification of cycles (positive and negative feedbacks) allows us to judge the structural stability (or not) of the system.
If you analyze the map “Electricity Consumption Problems” (see Fig. 6.14), then there are five cycles in it: K-> Uh->V* U^ U"> Uh-> K* C>"> ^4"> ^3">
-> Vq, V7-> V5 -" VA -> V3 -" V6 -" V7, among which V5 -> -> Kj -> ^2~^ ^5 - one is negative.
Scenarios of object behavior, impulse modeling (scenario modeling)
Modeling of system behavior is based on a scenario approach.
From a fundamental point of view, a scenario corresponds to the following ontology: initial state, sequence of events, final state. In other words, metaphorically, the scenario is structured in the time dimension by the “source - path - goal” scheme, where the source is the initial state, the final state is the destination, events are being on the path, and the path is extended in time.
The script is whole, and each of the elements - Part.
A script ontology typically also includes people, things, properties, relationships, and propositions. In addition, ontology elements are often connected by relations of certain types: causal relations, identity relations, etc. These relationships are structurally represented by communication schemes (link schemas), each of which is categorized according to the type of connection it represents. Scenarios also have goal structures that specify the goals of the participants in the scenario.
The definition of the concept “scenario” is associated with the definition of the concepts “signs of the system”, “state of the system”, “behavior of the system”, “expected event”, “situation”.
Signs characterize the properties of the system, subsystems and elements. Signs may be quality And quantitative. A sign can be a measure of effectiveness. Measuring a trait is often a major challenge.
State system is characterized by the values of features at a given time. The states of the system change during its operation.
Transitions of a system (or its parts) from state to state cause flows, defined as the rate of change in the values of the system’s attributes.
System behavior - this is a change in system states over time.
Expected Event the behavior of an object, according to the developed model of the object, is a triple: a moment in time t, selected according to some selection rules A (selection rule A indicates the moments of time for fixing the command trajectory of the object), dg(g) and g/(g) - the expected implementation of the parameters of the description of the environment and the phase trajectory of the system.
Situation 5(0 at a point in time r is a set of events chronologized in time that occurred before the moment b.
Scenario - This is a set of trends that characterize: situation at the moment, the desired development goals, a set of measures influencing the development of the situation, and systems for observing parameters (factors) illustrating the behavior of processes.
The depth of the scenario, the horizon of the scenario, and the time step of the scenario are determined. Present the scenario in a formalized form.
The scenario can be modeled in three main directions:
- forecast of the development of the situation without any impact on the processes: the situation develops on its own (evolutionary development);
- forecast of the development of the situation with the selected set of control measures (direct task);
- synthesis of a set of measures to achieve the necessary change in the state of the situation (inverse problem).
Modeling the propagation of disturbances on cognitive maps, impulse processes. The modeling object can be considered as a set of interacting dynamic processes occurring in real time. Time must also be present in the process model, but when modeled with different types of graphs, this time may not have the meaning of time, but reflect only a sequence of state changes. This is the case for signed digraphs and signed parametric graphs. To describe interaction with the environment, the concepts “input”, “output”, “state”, “behavior” of the system are used.
When analyzing situations based on cognitive map models, two types of problems are solved: static and dynamic. Static analysis - this is an analysis of the current situation, including the study of the influence of some factors on others, the study of the stability of the situation as a whole and the search for structural changes to obtain stable structures.
Dynamic analysis - This is the generation and analysis of possible scenarios for the development of the situation over time. The mathematical apparatus of analysis is the theory of signed graphs and fuzzy graphs.
Under the influence of various disturbances, the values of variables at the vertices of the graph may change; a signal received at one of the vertices propagates along the chain to the rest, intensifying or attenuating.
Pulse modeling - This is a modeling of the propagation of disturbances on cognitive maps, caused by the introduction of disturbance impulses into a vertex (a set of vertices) of a cognitive map. The modeling object can be considered as a set of interacting dynamic processes occurring in real time.
Scenario analysis allows us to judge the behavior of the system and scientifically predict the paths of its possible development. The analysis is carried out based on the results of impulse modeling. To generate possible scenarios for the development of the system, hypothetical disturbing or control influences are introduced into the vertices of the cognitive map. When introducing disturbances<2,(и) исследуется вопрос "что будет в момент (и + 1), если...?". Набор реализаций импульсных процессов - это "сценарий развития", он указывает на возможные тенденции развития ситуаций.
The impulse process can reflect both the evolutionary development of the system and its development under the influence of disturbances and control influences 0,^), added to the top 1>1 at moment g„.
Scenario for the development of situations It is customary to call the entire set of impulse processes at all vertices of the cognitive map. Thus, the set of impulse processes when disturbances are introduced<2 представляет собой модельную реализацию альтернативных действий (Л Для реальных систем 0_ interpreted as various management (for example, system development programs) or disturbing influences (for example, changes in the external environment, actions of a competitor, etc.).
The development scenarios generated under various disturbing influences are in fact a “scientific prediction” of possible paths of development of the system. The scenario characterizes the development trend of processes in the system, or more precisely, various possible development trends (consequences) with hypothetical changes in disturbing and control factors and their combinations (causes) in the simulated future. Thus, impulse modeling of the development of situations allows us to develop possible scenarios for the development of the system - from pessimistic to optimistic. Based on the scenarios, a system management strategy is designed, which is then implemented by decision makers in accordance with the dictating conditions of the external and internal environment.
Consider the rule (RY) changes in parameters at the vertices at the moment Let the parameter X! depends on time, i.e. X)(1)y 1= 1, 2, 3,.... Then we can determine the process of propagation of the disturbance along the graph, i.e. transition of the system from state £ - 1 to and I + 1,....
In the general case, if there are several vertices adjacent to V,-, the process of propagation of the disturbance through the graph is determined by the rule (for known initial values X(0) at all vertices and the initial disturbance vector P(0)):
where dg,(0 and x£1+ 1) - parameter values at vertex V; in moments By I + 1, p^£) - change in top U^ at a point in time G,
Since in the Φ-graph an impulse in an impulse process is represented as an ordered sequence without reference to time, you can use the notation of formulas “at the i-th moment of time” (in a process model when modeling with different types of graphs, time may not have the meaning of time, but reflect only sequence of state changes (this occurs for signed digraphs and signed weighted digraphs). Function py(/;) of the influence of changes in adjacent U-) vertex V) can be replaced by impulse p(n) = x(n + 1) - x(n), Where x(n)y x(n+ 1) - the value of the indicator at the vertex V at simulation steps at moment £ = P and following it £ = P+ 1. Then formula (6.64) is transformed to the form
Rule(Pd) changes in parameters at the vertices at time £u+1, if at time ip impulses arrived at the vertices:

The model of an impulse process is a tuple (F. £>, RShch, where φ is the φ-graph, (2= 0,(1,) - sequence of disturbing influences, RY - rule for changing parameters. In this case, the sequence X(r0),<2(гн)^ является модельным представлением динамической системы (г0,50,В0).
To develop appropriate computational algorithms, it is convenient to present the mathematical model of impulse processes on signed graphs in matrix form.
i = 0, 1, 2, introduced into the vertices of Y; at time £; the vector of vertex parameters at time t and changes in vertex parameters are given by the equations:
For R, from the last equation we obtain the expression
where / is the identity matrix.
Autonomous called a special case of impulse processes on cognitive maps, when external impulses are introduced only once at the beginning of the simulation.
The simplest variant of disturbance propagation is the case when P(0) has only one non-zero input, i.e. the disturbance arrives at only one vertex V-r Such processes are usually called simple processes.
Situation in impulse modeling is characterized by a set of all Q and values X in every P modeling step.
Let's give an example of impulse modeling using a cognitive map of electricity consumption problems (Fig. 0.19). For it, the relationship matrix has the form

Let's model the process of disturbance propagation using a cognitive map of electricity consumption problems: “What will happen if electricity consumption increases?” (Fig. 6.18). As can be seen from the graphs of impulse processes, the trends in the development of situations do not contradict intuitive assumptions that an increase in electricity consumption due to an increase in energy capacity can lead to a drop in its cost, deterioration of the environment, an increase in the number of enterprises, and an increase in the number of jobs. The graphs show simulation cycles along the OX axis. P, but the 0Y axes of numbers characterize the rate of growth of signals at the vertices of the cognitive map (scientific prediction of possible development trends).

Rice. 6.18. Increase in electricity consumption,<7/(= +1, вектор возмущений (2= (0,0,0 + 1,0,0,0)
Inverse problems, controllability and observability problems
Solving the inverse problem is a search for such values of control actions (2) that can provide the desired scenario for the development of the system. Mathematical programming methods (linear, nonlinear) can be used for the solution.
Solutions to problems of observability and controllability of a system are interrelated. Observability problem - the problem of determining the sufficiency of measurements of output variables to determine unknown initial values of inputs. Controllability problem - this is a problem about the possibility of changing system inputs depending on the observed outputs (cybernetic or management approach).
Analysis of the stability of a system represented by a graph
Sustainability is a multidimensional concept. In studies of socio-economic systems, the term “sustainability” means a lot, not always clearly defined (sustainability of the financial system, sustainability of the organization). In the theory of control of technical systems, the concept of “stability” is clearly defined, and criteria for system stability have been developed (“stability according to Lyapunov”, according to Poincaré, etc.). Two aspects of the concept of “stability” are considered: the stability of the system under the influence of external disturbances with a fixed structure of the system, i.e. when only the external environment changes, and the stability of the behavior of the system when the structure of the system changes is structural stability (small changes in the structure of the system cause small changes in its dynamics).
When studying the stability of a weighted directed graph - a cognitive map - the stability in value and stability in disturbance of the system are examined as it evolves.
Let us introduce the concepts of an algebraic criterion for stability by disturbance and initial value and consider the connection between the stability of a graph and its topological structure, based on the works of V. V. Kulba, S. S. Kovalevsky, D. L. Kononov, A. B. Shelkov and others, as well as on the works of J. Cast.
The fundamental idea when developing criteria for the stability of graphs is the idea of the characteristic values of the relationship matrix L(; graph - cognitive model.
The characteristic values of the graph are defined as the eigenvalues of the matrix Ac. According to the Routh-Hurwitz theorem for linear systems, if among the eigenvalues of the matrix (roots) there are no modulus numbers greater than one, then the system is stable under disturbance. Stability in disturbance does not mean stability in value, although the opposite is true. But there are significant restrictions on the application of this criterion, so we will use it in simple cases.
For the above example of electricity consumption problems (see Fig. 6.18), the number of matrix roots Ace equals 7, among which there is a root modulo greater than 1: M= 1.43. Consequently, this system is unstable neither in terms of disturbance nor in terms of the initial value. Actually, the fact of instability is illustrated by graphs of impulse processes (see Fig. 6.18) - the graphs diverge.
Structural and cohesive stability of the system
The position of equilibrium states depends on the dynamic properties of the system being studied and can change. Therefore, another question arises: will a small change in the system lead to a shift in the equilibrium state? That is, in contrast to the classical theory of stability, which did not consider changes in the system, but only disturbances in the environment, it is necessary to study problems of stability during structural changes in the system itself. This is practically a very important question, since these changes, even small ones, can lead to drastic qualitative changes in the further behavior of the system. One of the tools for studying such phenomena is the theory of catastrophes, or the theory of bifurcations.
There is a “combined” concept of stability, combining the classical ideas of Lyapunov with the combinatorial-topological approach - the concept of connected stability, which originally arose in connection with the study of equilibrium issues in economics. When studying connected stability, the problem is formulated as follows: will the equilibrium state of a given system remain stable in the Lyapunov sense, regardless of the double connections between the states of the system?
Let's define a matrix of relations Ac. State of balance X = O is considered connection stable if it is Lyapunov stable for all possible interconnection matrices
The study of coherent sustainability is of practical interest, especially in the study of organizational systems such as the economic system. This is due to the fact that when describing processes in these systems, the presence or absence of this connection may not always be obvious due to disruptions in the operation of the system itself, the presence of disturbances, and the known subjectivity of the mathematical model of the system.
Adaptability systems is another aspect of sustainability. Adaptability can be thought of as a certain measure of a system's ability to absorb external disturbances without pronounced consequences for its behavior in a transition or steady state.
The concept of adaptability is close to the concept of structural stability, but is somewhat broader than it.
Let us consider the main provisions related to the study of the structural stability of systems. The classical idea of stability is very fruitful in technical and physical systems. For sociotechnical, socio-economic systems, such a representation can be used, but this requires serious justification for specific systems. Moreover, the normal mode of operation of these systems is far from equilibrium; in addition, external disturbances constantly change the state of equilibrium itself. The central element of modern views on sustainability is the concept of structural sustainability, which we will consider further.
The main task of studying structural stability is to identify qualitative changes in the trajectory of the system when the structure of the system itself changes. There is a need to consider a group of systems “close” to some standard one, i.e. we are dealing with a family of trajectories that needs to be explored. In such a situation one speaks of structural stability.
A system is called structurally stable if the topological nature of the trajectories of all systems close to it is the same as that of the standard one.
Thus, the property of structural stability is that the system under consideration behaves almost the same as those close to it; otherwise, the system is structurally unstable. The level of structural stability characterizes generalized information about the degree of stability of a system or its individual elements to external and internal disturbances of a given nature.
For all the problems formulated above, a number of mathematical difficulties arise related to how to determine what “small perturbations”, “trajectories close to the origin of coordinates”, “close systems”, “trajectories typologically similar to one another” are. For some specific classes of systems these difficulties have been overcome.
We can distinguish two groups of methods for mathematical analysis of the structural stability of a model, written in the language of signed digraphs. The first is based on a number of theorems connecting the spectrum of a digraph with its stability in simple impulse processes, the second is on the transformation of the original signed digraph into a matrix model with a detailed analysis of the latter. The structural stability of the system can be established by analyzing the cycles of the cognitive map.
When analyzing a cognitive map by identifying cycles in it, the concepts of even and odd cycles are used. We already mentioned above about positive and negative feedback loops. There is a relationship between the type of cycle and the stability of the system.
An even cycle is the simplest model of structural instability, since any initial change in a parameter at any of its vertices leads to an unlimited increase in the modulus of the parameters of the vertices of the cycle. Any change in the parameter of any vertex of an odd cycle only leads to oscillation of the vertex parameters. A signed digraph that does not contain cycles or contains only one cycle is impulse stable for all simple impulse processes.
Until now, we have been talking about a formal analysis of the stability of cognitive maps of complex systems. It is necessary to keep in mind one more serious aspect of the study of the stability of cognitive maps used in other areas of cognitive research. In this sense, the analysis of the stability of cognitive maps consists in determining balanced, consistent, stable cognitive structures and, conceptually, is based on the main provisions of the theories of social psychology: cognitive dissonance by L. Festinger, structural balance by F. Heider, communication acts by T. Newcomb.
The challenge of system complexity and connectivity
The concept of “connectivity” of a system arises together with the concept of “structure” of the system. With the disappearance of structural connectivity, the system disappears. The mathematical description of the problem of connectivity analysis is most successfully obtained in the language of graph theory and algebraic topology. The first method is based on analyzing the connectivity of a graph model using graph theory methods. The second approach is based on the study of the topological properties of the graph model using the matrix of relations of the cognitive map, the so-called ^-analysis of the connectivity of simplicial complexes. The foundations of the topological study of complex systems based on the study of their structural properties began in the 1960-1970s. Currently, the effectiveness of using simplicial complexes for modeling the connectivity properties of various networks of interacting elements (subsystems, entities...), such as communications, traffic, biological networks, networks of distributed algorithms, has been shown. It has been proven that simplicial complexes are very useful in studying dynamic processes in networks.
The mathematical foundations of polyhedral analysis were laid by K. Drowker, and the analysis was further developed in the works of the British physicist R. Etkin. He developed the first tool for simplicial analysis, called ^-analysis (polyhedral analysis, or analysis of polyhedral dynamics). Despite the fact that the application of ^-analysis to the study of social, biological, economic and other complex systems has shown its effectiveness, there are not many publications in this direction (the earliest ones are the works of R. Etkip, J. Casti, S. Seidman, J. Johnson, K. Earl, P. Gould, H. Kauklklis, S. McGill, A. Cullen, H. Griffith, G. Varsello, H. Kramer, R. Axelrod, R. Laubenbacher). In recent years, in our country, interest has also begun to be observed in the application of topology methods in the study of the structures of complex systems (for example, V.B. Mnukhin, O.Yu. Kataev, etc.) "but these and other mathematical works are of a theoretical nature, and in relation to in the study of socio-economic systems, such studies are now extremely rare. The method of analyzing (/-connectivity allows us to judge the connectivity of a system more deeply than traditional studies of graph connectivity, since this establishes the presence of mutual influence of simplicial blocks of the system through a chain of connections between them. Based on such capabilities formalized rules are proposed to justify the choice of target and control vertices, determination of the stability of systems characterized by certain simplicial complexes, conditions for the structural stability of systems. Determination of the number of simplexes and their structure, analysis of the ^-connectivity of the system allows us to put forward justifications for solving problems of decomposition and composition of the studied social system economic system, to identify simplices that most influence the processes in the system and the forming vertices of which are more rationally selected as managers. f-analysis allows us to reveal the multidimensional geometry of complex systems, trace the influence of various local changes on the structure of the system as a whole, and focus specifically on the structural features of the system, which is not revealed by other approaches. The use of this method for the analysis of structurally complex systems allows us to take a different approach to the very definition of the concept of “complexity”, to more deeply reveal the role of individual elements and their influence on other elements of the system.
Let us refer to Section 7.4, which sets out the basics of analyzing the ^-connectivity of the system. In this analysis, the system is considered as a relationship between elements of finite sets - sets of vertices Un of a given family of non-empty subsets of these vertices - simplexes a. Sets of vertices and corresponding simplices form simplicial complexes TO. To construct them, special techniques for constructing (expert) incident matrix L can be used:

but a ready-made system structure can be used, specified in the form of a graph C = <У, £>, which serves as the basis for its geometric and algebraic representation as a simplicial complex. A simplicial complex consists of a set of vertices (U) and sets of non-empty finite subsets of the set (V,-), called simplices (a simplicial complex is obtained by partitioning some space X(or Y) into intersecting subsets; a space that allows such a partition is called a polyhedron, and the process of its partition is called triangulation).
The simplex is denoted as 8^)^, where і - vertex number, and ts - geometric dimension of the simplex. Number d determined by the number of arcs connecting the vertices U) in a simplex through a variable xg Number ts(number of arcs incident y-) is one less than the number of ones (“”) in the corresponding /-row of the matrix A. If there is no 1 in the row of the matrix A, then we denote the dimension of the “empty” simplex: # = O -- 1 = -1. The dimension of a simplex is the number of edges in each vertex of a complete graph - a simplex.
Chains of ^-connectivity are formed through connections of vertices of the same name. Communication circuit reflects the possibility that two simplices, without directly having a common edge, can be connected using a sequence of intermediate simplices.
Without giving strict definitions of the analysis of ^-connectivity (see section 7.4), we illustrate the construction of a simplicial complex with an example of problems of electricity consumption (special algorithms for constructing simplicial complexes of large dimension have been developed for PS CM). By matrix Ace one can define its simplicial complexes - by rows KX(Y, X) and by columns Ku(X, X*), Where X- rows, U - columns, X- matrix of relations between elements (Ac), X* - transposed matrix.
Let's build a complex KX(Y, X) - by lines.
First line: §(1)b/=і і=и. a simplex consists of one vertex UA.
^2- &2=-io> a simplex consists of one vertex U$ . U: 8^/=2-=y the simplex consists of two vertices interconnected through Y - Wow And Yeh.
U: 8*4^_з_1=2, the simplex consists of three vertices - U^U And U$.

U$: 8<5)^=]_1=0т симплекс состоит из одной вершины UA. U§. 8^6^d-2-1=1" simplex consists of two vertices - U And U-g
![]()
U7: 8(7^=3_1=0, simplex consists of one vertex UGG Thus, the simplicial complex has the form: VD Ya.) = (8(1)9=0; 5(2)^,; 8(3>9=2; 8(4)d=3; b^; 80)^}.
Since there are no simplices of dimension greater than 2 in this complex, it can be depicted geometrically on a plane (Fig. 6.19).

Rice. 6.19. Kx( Uh, X)
As we can see, the complex is incoherent; it has three separate components, which may indicate weak controllability of this structure.
The concepts of connectivity and complexity of a system are interdependent. Consider: structural complexity, dynamic complexity, computational complexity, evolutionary complexity; internal and external complexity. In order for the system to implement a given type of behavior regardless of external interference, diversity in its behavior can be suppressed only by increasing the set of controls (Ashby's principle of necessary diversity). This ability of the system characterizes the “complexity of control.” A system cannot be “universally complex.” It can be complex from some positions and uncomplicated from others. The “complexity” of systems often leads to the fact that it is easier to first study the elements and components of the system, and then, based on the knowledge gained, try to understand the system as a whole. Therefore, the task of analyzing the complexity of a system is associated with problems of decomposition and composition of the system.
Methods for constructing cognitive models of complex systems
Methods for constructing cognitive models must: meet the requirements of convenience and constructiveness; be closely connected with methods for assessing the results of analysis so that in the decision-making process the cognitive model can serve as an adviser and critic to the decision-maker; accurately reflect the decision maker’s ideas about concepts and relationships between them; should not require the compiler of a cognitive model to pre-specify concepts.
Currently, a large number of methods are proposed for constructing cognitive models of complex systems. But all this is closer to art than to strict rules, although a large number of tools have been developed to help the researcher develop one or another cognitive map. These methods can be summarized as follows:
- development of cognitive models (cognitive maps) with the help of subject matter experts. Various expert methods and technologies for working with experts are used (including work in situation centers; for this purpose, enough special software options have been developed, for example ArchiDoca, developer of the non-profit partnership for scientific research and social development Analytical Agency "New Strategies", head A.N. . Raikov);
- development of cognitive models by a researcher (cognitive engineer) together with a specialist in the subject area;
- development of cognitive models (or their blocks) based on the results of statistical data analysis using programs Data mining and also using special software (for example, computer LOC method, developers V. N. Zhikharev, A. I. Orlov, V. G. Koltsov);
- development of cognitive models based on the analysis of texts containing information about the subject area;
- development of cognitive models based on the analysis of existing theories in the subject area, use of ready-made cognitive schemes.
When developing cognitive maps with the help of experts, the following methods can be recommended.
1st method. The cognitive map is built by the decision maker himself, based on his knowledge and ideas, without the involvement of experts or reference materials.
The advantage of the method: the speed of constructing a cognitive map. Disadvantage: the adequacy of a cognitive map highly depends on the qualifications of the decision maker, his knowledge and ability to sense the nature of the relationships between concepts.
Building a cognitive map helps the decision maker to imagine the problem more clearly, to better understand the role of individual components and the nature of the relationships between them.
2nd method. Construction of cognitive maps by experts based on studying documents.
Advantage: the method is convenient and allows you to use data used by the decision maker himself. Disadvantage: examining documents by experts is a lengthy and labor-intensive process.
3rd method. Construction of a cognitive map based on a survey of a group of experts who have the ability to assess cause-and-effect relationships.
Advantage: the ability to aggregate individual opinions and be based on a larger range of assessments than can be extracted from the documents being studied. Disadvantage: labor intensive.
4th method. Construction of cognitive maps based on open sample surveys. Advantages: the method can be used to construct comparative cognitive maps; in addition, the researcher has the opportunity to conduct an active dialogue with sources of information. Disadvantage: labor intensive.
A detailed example of the development of cognitive maps with the help of experts is given in the works of the IPU RAS staff, for example in the book by E. A. Trakhtengerts, as well as in the works.
If cognitive modeling of a real socio-economic or other complex system is being carried out, the use of a combination of these methods and techniques can be recommended.
Adequacy of the model
The effectiveness of applying a cognitive model in practice depends on its correspondence to the real situation. The inadequacy of a model when used to develop strategies for the development of a system and make management decisions can have much larger negative consequences than an unsuccessful cognitive model built by an individual in the process of increasing his £1 (in experiments by cognitive psychologists it has been shown that the technique of cognitive maps is one of the most effective thinking technique, using both hemispheres of the brain, increasing the level of intelligence, developing memory, etc.). Checking the adequacy of a cognitive model is one of the ambiguously solved problems.
In general, this check can be carried out as follows.
Let there be relationships between the basic factors, which are the vertices of the graph model, that can be interpreted as all kinds of axioms of the subject area. As a rule, these relationships are formed in the form of products like:
where X;, G = 1,2.....To - some characteristic of the basic factor V-,(for example, the limiting value of the factor, the sign of the factor increment, etc.). The totality of such products forms basic knowledge about a given subject area.
A graph model is considered adequate to the real situation if none of the basic knowledge products are violated in the model processes.
The completeness of checking a model for adequacy depends on the completeness of basic knowledge, which is determined by the ratio of the number of situation states reflected in basic knowledge to the total number of situation states.
If basic knowledge about the situation under study is missing, the past behavior of processes may have no influence on their future behavior. Therefore, no acceptable prediction of these processes is possible.
Thus, from the most general positions, checking the adequacy of a model is a comparison of information about the actually modeled system, which is obtained empirically in a certain area of system parameters, with the information that the model provides in the same area of system parameters. If the differences are small from the point of view of modeling purposes, then the model is considered adequate.
The quality and effectiveness of cognitive analysis are related both to the subjectivity of the decision-maker and to the fact that the research itself influences the results. There is a relationship between the participants' thinking and the situation in which they participate. This relationship manifests itself in two ways, in the form of two dependencies: cognitive (passive), expressing the effort of the participants spent on understanding the situation, and control (active), associated with the effect of their conclusions on the situation in the real world. In cognitive function, participants' perceptions depend on the situation, while in executive function, they influence the situation.
Thus, the presence of thinking participants in the system, each of whom represents the situation in their own way and makes certain decisions based on their “virtual” representation, leads to the fact that, in the words of J. Soros, “... the sequence of events does not lead directly from one set of factors to another; instead, it cross-links factors with their perceptions, and perceptions with factors."
This leads to the fact that the processes in the situation do not lead to equilibrium, but to a never-ending process of change. It follows that as a result of interaction, both the situation and the views of the participants are dependent variables and the primary change accelerates the onset of further changes both in the situation itself and in the views of the participants. Scheme of cognitive modeling in Fig. 6.17 provides for this fact. The researcher’s confidence in the adequacy of the model arises or not both as a result of solving each system problem separately, and in comparing all the results as a whole.
So, for example, if the trends in the development of situations according to any simulated development scenario corresponding to a specific state of the socio-economic system do not contradict the observed trends in processes in the real system (time series of statistical data), then such a graph model can be considered adequate. Or if the developed structure - a cognitive map - is unstable, but in reality the stability of the system under study is observed, then natural doubt arises in the developed model. A numerical measure of the adequacy of all results in the aggregate has not been developed (while the question remains open whether this is possible in principle), we have to return to the general definition: “a graph model is considered adequate to the real situation if none of the basic knowledge products is violated in the model processes ".
Problems of the adequacy of cognitive models never cease to worry researchers. And currently, the team of Sector 51 of the Institute of Computer Science of the Russian Academy of Sciences is carrying out serious work in the field of checking cognitive maps. The concepts of “informal” and “formal” cognitive maps are used. Thus, the drawings of cognitive maps in this paragraph refer to informal maps. Parametric functional graphs can be classified as formal.
An example of the use of cognitive modeling technology is given in Appendix 6.
Cognitive modeling methodology for analyzing and making decisions in ill-defined situations was proposed by Axelrod. It is based on modeling the subjective ideas of experts about the situation and includes: methodology for structuring the situation: a model for representing the expert’s knowledge in the form of a signed digraph (cognitive map) (F, W), where F is the set of factors of the situation, W is the set of cause-and-effect relationships between factors situations; methods of situation analysis. Currently, the methodology of cognitive modeling is developing in the direction of improving the apparatus for analyzing and modeling the situation. Models for forecasting the development of the situation are proposed here; methods for solving inverse problems
A cognitive map (from Latin cognitio - knowledge, cognition) is an image of a familiar spatial environment.
Cognitive maps are created and modified as a result of the active interaction of the subject with the outside world. In this case, cognitive maps of varying degrees of generality, “scale” and organization can be formed (for example, an overview map or a path map, depending on the completeness of the representation of spatial relationships and the presence of an expressed point of reference). This is a subjective picture that has, first of all, spatial coordinates in which individual perceived objects are localized. There is a path map as a sequential representation of connections between objects along a specific route, and an overview map as a simultaneous representation of the spatial location of objects.
The leading scientific organization in Russia engaged in the development and application of cognitive analysis technology is the Institute of Management Problems of the Russian Academy of Sciences, division: Sector-51, scientists Maksimov V.I., Kornoushenko E.K., Kachaev S.V., Grigoryan A.K. and others. This lecture is based on their scientific work in the field of cognitive analysis.
The technology of cognitive analysis and modeling (Figure 1) is based on the cognitive (cognitive-target) structuring of knowledge about an object and its external environment.
Figure 1. Technology of cognitive analysis and modeling
Cognitive structuring of a subject area is the identification of future target and undesirable states of a control object and the most significant (basic) factors of control and the external environment that influence the transition of the object to these states, as well as the establishment at a qualitative level of cause-and-effect relationships between them, taking into account mutual influence factors on each other.
The results of cognitive structuring are displayed using a cognitive map (model).
2. Cognitive (cognitive-target) structuring of knowledge about the object under study and its external environment based on pest analysis and swot analysis
The selection of basic factors is carried out by applying PEST analysis, which identifies four main groups of factors (aspects) that determine the behavior of the object under study (Figure 2):
P olicy - politics;
E economy - economy;
S ociety - society (sociocultural aspect);
T echnology - technology

Figure 2. PEST analysis factors
For each specific complex object there is its own special set of the most significant factors that determine its behavior and development.
PEST analysis can be considered as a variant of system analysis, since factors related to the listed four aspects are, in general, closely interrelated and characterize various hierarchical levels of society as systems.
This system has determinative connections directed from the lower levels of the system hierarchy to the upper ones (science and technology influences the economy, the economy influences politics), as well as reverse and inter-level connections. A change in any of the factors through this system of connections can influence all the others.
These changes may pose a threat to the development of the object, or, conversely, provide new opportunities for its successful development.
The next step is a situational analysis of problems, SWOT analysis (Figure 3):
S trengths - strengths;
W eaknesses - shortcomings, weaknesses;
O pportunities - opportunities;
T hreats - threats.

Figure 3. SWOT analysis factors
It includes an analysis of the strengths and weaknesses of the development of the object under study in their interaction with threats and opportunities and allows us to identify current problem areas, bottlenecks, chances and dangers, taking into account environmental factors.
Opportunities are defined as circumstances conducive to the favorable development of an object.
Threats are situations in which damage to an object may be caused, for example, its functioning may be disrupted or it may lose its existing advantages.
Based on the analysis of various possible combinations of strengths and weaknesses with threats and opportunities, the problem field of the object under study is formed.
The problem field is a set of problems that exist in the modeled object and the environment, in their relationship with each other.
The availability of such information is the basis for determining development goals (directions) and ways to achieve them, and developing a development strategy.
Cognitive modeling based on the conducted situational analysis makes it possible to prepare alternative solutions to reduce the degree of risk in identified problem areas, to predict possible events that may have the most serious impact on the position of the modeled object.
The stages of cognitive technology and their results are presented in Table 1:
Table 1
Stages of cognitive technology and results of its application
|
Stage name |
Result presentation form |
|
1. Cognitive (cognitive-target) structuring of knowledge about the object under study and its external environment based on PEST analysis and SWOT analysis: Analysis of the initial situation around the object under study, highlighting the basic factors characterizing economic, political and other processes occurring in the object and in its macroenvironment and influencing the development of the object. 1.1 Identification of factors characterizing the strengths and weaknesses of the object under study 1.2 Identification of factors characterizing opportunities and threats from the external environment of the object 1.3 Construction of the problem field of the object under study |
Report on a systemic conceptual study of an object and its problem area |
|
2. Construction of a cognitive model of object development - formalization of knowledge obtained at the stage of cognitive structuring 2.1 Identification and justification of factors 2.2 Establishment and justification of relationships between factors 2.3 Construction of a graph model |
Computer cognitive model of an object in the form of a directed graph (and matrix of factor relationships) |
|
3. Scenario study of trends in the development of the situation around the object under study (with the support of the software systems "SITUATION", "COMPASS", "KIT") 3.1 Determining the purpose of the study 3.2 Setting research scenarios and modeling them 3.3 Identification of development trends of an object in its macroenvironment 3.4 Interpretation of scenario study results |
Report on the scenario study of the situation, with interpretation and conclusions |
|
4. Development of strategies for managing the situation around the object under study 4.1 Definition and justification of the management goal 4.2 Solving the inverse problem 4.3 Selection of management strategies and ordering them according to criteria: possibility of achieving the goal; risk of losing control of the situation; emergency risk |
Report on the development of management strategies with justification of strategies according to various criteria of management quality |
|
5. Search and justification of strategies for achieving goals in stable or changing situations For stable situations: a) selection and justification of the management goal; b) selection of activities (controls) to achieve the goal; c) analysis of the fundamental possibility of achieving the goal from the current state of the situation using selected activities; d) analysis of real restrictions on the implementation of selected activities; e) analysis and justification of the real possibility of achieving the goal; f) development and comparison of strategies for achieving the goal by: proximity of management results to the intended goal; costs (financial, physical, etc.); by the nature of the consequences (reversible, irreversible) from the implementation of these strategies in a real situation; on the risk of emergency situations For changing situations: a) selection and justification of the current management goal; b) in relation to the current goal, the previous paragraphs b-f are valid; c) analysis of changes occurring in the situation and their display in a graph model of the situation. Go to point a. |
Report on the development of strategies for achieving goals in stable or changing situations |
|
6. Development of a program for implementing the development strategy of the object under study based on dynamic simulation modeling (with the support of the Ithink software package) 6.1. Distribution of resources by area and over time 6.2 Coordination 6.3 Monitoring of execution |
Program for implementing the site development strategy. Computer simulation model of object development |
COGNITIVE SIMULATION
CONTENT
Introduction
1. Subject of cognitive analysis
1.1. External environment
1.2. Instability of the external environment
1.3. Poorly structured external environment
2. General concept of cognitive analysis
3. Stages of cognitive analysis
4. Goals, stages and basic concepts of cognitive modeling
4. 1. The purpose of building a cognitive model
4.2. Stages of cognitive modeling
4.3. Directed graph (cognitive map)
4.4. Functional graph (completing the construction of a cognitive model)
5. Types of factors
6.1.Identification of factors (elements of the system)
6.2. Two approaches to identifying relationships between factors
6.3.Examples of identifying factors and connections between them
6.4. The problem of determining the strength of influence of factors
7. Checking the adequacy of the model
8. Using a cognitive model
8.1. Application of cognitive models in decision support systems
8.2. An example of working with a cognitive model
9. Computer systems to support management decisions
9.1. General characteristics of decision support systems
9.2. "Situation - 2"
9.3. "Compass-2"
9.4. "Canvas"
Conclusion
Bibliography
Application
Introduction
Currently, obtaining reliable information and its rapid analysis have become the most important prerequisites for successful management. This is especially true if the control object and its external environment are a complex of complex processes and factors that significantly influence each other.
One of the most productive solutions to problems arising in the field of management and organization is the use of cognitive analysis, which is the subject of study in the course work.
The cognitive modeling methodology, intended for analysis and decision-making in poorly defined situations, was proposed by the American researcher R. Axelrod 1.
Initially, cognitive analysis was formed within the framework of social psychology, namely, cognitivism, which studies the processes of perception and cognition.
The application of the developments of social psychology in management theory led to the formation of a special branch of knowledge - cognitive science, concentrating on the study of problems of management and decision making.
Now the methodology of cognitive modeling is developing in the direction of improving the apparatus for analyzing and modeling situations.
The theoretical achievements of cognitive analysis became the basis for the creation of computer systems aimed at solving applied problems in the field of management.
Work on the development of the cognitive approach and its application to the analysis and control of so-called semi-structured systems is currently being carried out at the Institute of Control Problems of the Russian Academy of Sciences 2 .
By order of the Administration of the President of the Russian Federation, the Government of the Russian Federation, and the Government of the City of Moscow, a number of socio-economic studies using cognitive technology were carried out at the IPU RAS. The recommendations developed are successfully applied by the relevant ministries and departments 3 .
Since 2001, under the auspices of the IPU RAS, international conferences “Cognitive Analysis and Management of Situation Development (CASC)” have been regularly held.
When writing the course work, the works of domestic researchers were involved - A.A. Kulinich, D.I. Makarenko, S.V. Kachaeva, V.I. Maksimova, E.K. Kornoushenko, E. Grebenyuk, G.S. Osipova, A. Raikova. Most of the named researchers are specialists from the IPU RAS.
Thus, cognitive analysis is being quite actively developed not only by foreign, but also by domestic specialists. However, within the framework of cognitive science, a number of problems remain, the solution of which could significantly improve the results of applied developments based on cognitive analysis.
The purpose of the course work is to analyze the theoretical basis of cognitive technologies, problems of the methodology of cognitive analysis, as well as computer decision support systems based on cognitive modeling.
The structure of the work corresponds to the set goals, which consistently reveals the basic concepts and stages of cognitive analysis in general, cognitive modeling (as a key point of cognitive analysis), general principles of applying the cognitive approach in practice in the field of management, as well as computer technologies that apply methods of cognitive analysis.
1. Subject of cognitive analysis
1.1. External environment
For effective management, forecasting and planning, an analysis of the external environment in which management objects operate is required.
The external environment is usually defined by researchers as a set of economic, social and political factors and entities that have a direct or indirect impact on the ability and ability of the entity (be it a bank, an enterprise, any other organization, an entire region, etc.) to achieve its development goals.
To navigate the external environment and analyze it, it is necessary to clearly understand its properties. Experts from the Institute of Management Problems of the Russian Academy of Sciences identify the following main characteristics of the external environment:
1. Complexity - this refers to the number and variety of factors to which the subject must respond.
2. The relationship of factors, that is, the force with which a change in one factor affects changes in other factors.
3. Mobility - the speed with which changes occur in the external environment 4.
The identification of these types of characteristics to describe the environment indicates that researchers apply a systems approach and consider the external environment as a system or a set of systems. It is within the framework of this approach that it is customary to represent any objects in the form of a structured system, to highlight the elements of the system, the relationships between them and the dynamics of development of the elements, relationships and the entire system as a whole. Therefore, cognitive analysis, used to study the external environment and develop ways and methods of functioning in it, is sometimes considered as a component of systems analysis 5 .
The specificity of the external environment of control objects is that this environment is subject to the influence of the human factor. In other words, it includes subjects endowed with autonomous will, interests and subjective ideas. This means that this environment does not always obey linear laws that unambiguously describe the relationship of causes and effects.
This implies two basic parameters of the external environment in which the human factor operates - instability and weak structure. Let's take a closer look at these parameters.
1.2. Instability of the external environment
The instability of the external environment is often identified by researchers with unpredictability. “The degree of instability of the economic and political environment external to... [the object of management] is characterized by the familiarity of expected events, the expected pace of change, and the ability to predict the future” 6 . This unpredictability is generated by multifactoriality, variability of factors, pace and direction of development of the environment.“The combined effect of all environmental factors, summarize V. Maksimov, S. Kachaev and E. Kornoushenko, forms the level of its instability and determines the feasibility and direction of surgical intervention in ongoing processes” 7 .
The higher the instability of the external environment, the more difficult it is to develop adequate strategic decisions. Therefore, there is an objective need to assess the degree of instability of the environment, as well as to develop approaches to its analysis.
According to I. Ansoff, the choice of strategy for managing and analyzing situations depends on the level of instability of the external environment. With moderate instability, conventional control is applied based on extrapolation of knowledge about the past of the environment. At an average level of instability, management is carried out on the basis of a forecast of changes in the environment (for example, “technical” analysis of financial markets). At a high level of instability, management is used based on flexible expert decisions (for example, “fundamental” 8 analysis of financial markets) 9 .
1.3. Poorly structured external environment
The environment in which management subjects are forced to work is characterized not only as unstable, but also as poorly structured. These two characteristics are strongly interrelated, but different. However, sometimes these terms are used as synonyms.Thus, specialists from the Institute of Control Sciences of the Russian Academy of Sciences, when defining weakly structured systems, point out some of their properties that are also inherent in unstable systems: “The difficulties of analyzing processes and making management decisions in such areas as economics, sociology, ecology, etc. are caused by a number of features inherent in these areas, namely: the multifaceted nature of the processes occurring in them (economic, social, etc.) and their interconnectedness; due to this, it is impossible to isolate and conduct a detailed study of individual phenomena - all phenomena occurring in them must be considered in their entirety; the lack of sufficient quantitative information about the dynamics of processes, which forces us to move to a qualitative analysis of such processes; variability of the nature of processes over time, etc. Due to these features, economic, social, etc. systems are called weakly structured systems” 10.
However, it should be noted that the term “instability” implies the impossibility or difficulty of predicting the development of a system, and weak structure implies the impossibility of formalizing it. Ultimately, the characteristics “instability” and “weakly structured,” in my opinion, reflect different aspects of the same phenomenon, since we traditionally perceive a system that we cannot formalize and thus absolutely accurately predict its development (that is, a weakly structured system) , as unstable, prone to chaos. Therefore, here and further, following the authors of the studied articles, I will use these terms as equivalent. Sometimes researchers, along with the above concepts, use the term “complex situations”.
So, in contrast to technical systems, economic, socio-political and other similar systems are characterized by the absence of a detailed quantitative description of the processes occurring in them - the information here is of a qualitative nature. Therefore, for weakly structured systems it is impossible to create formal traditional quantitative models. Systems of this type are characterized by uncertainty, description at a qualitative level, and ambiguity in assessing the consequences of certain decisions 11 .
Thus, the analysis of an unstable external environment (weakly structured systems) is fraught with many difficulties. When solving them, you need the intuition of an expert, his experience, associative thinking, and guesses.
Computer tools for cognitive modeling of situations make it possible to cope with such an analysis. These tools have been used in economically developed countries for decades, helping enterprises to survive and develop their businesses, and authorities to prepare effective regulations 12 . Cognitive modeling is designed to help the expert reflect at a deeper level and organize his knowledge, as well as formalize his ideas about the situation to the extent possible.
2. General concept of cognitive analysis
Cognitive analysis is sometimes referred to by researchers as “cognitive structuring” 13 .Cognitive analysis is considered one of the most powerful tools for studying an unstable and poorly structured environment. It contributes to a better understanding of the problems existing in the environment, identification of contradictions and a qualitative analysis of ongoing processes. The essence of cognitive (cognitive) modeling - the key point of cognitive analysis - is to reflect the most complex problems and trends in the development of a system in a simplified form in a model, to explore possible scenarios for the emergence of crisis situations, to find ways and conditions for their resolution in a model situation. The use of cognitive models qualitatively increases the validity of management decisions in a complex and rapidly changing environment, relieves the expert from “intuitive wandering”, and saves time on understanding and interpreting events occurring in the system 14 .
IN AND. Maksimov and S.V. Kachaev, to explain the principles of using information cognitive technologies to improve management, uses the metaphor of a ship in a stormy ocean - the so-called “frigate-ocean” model. Most commercial and non-profit activities in unstable and poorly structured environments “inevitably involve risk, arising both from the uncertainty of future operating conditions and from the possibility of erroneous decisions made by management…. It is very important for management to be able to anticipate such difficulties and develop strategies to overcome them in advance, i.e. have pre-developed guidelines for possible behavior.” These developments are proposed to be carried out on models in which the information model of the control object (“frigate”) interacts with a model of the external environment - economic, social, political, etc. ("ocean"). “The purpose of such modeling is to give recommendations to the “frigate” on how to cross the “ocean” with the least “effort”... Of interest... are ways to achieve the goal, taking into account favorable “winds” and “currents”... So, we set the goal: to determine the “wind rose”... [ external environment], and then we’ll see which “winds” will be tailwinds, which will be counterwinds, how to use them and how to discover the properties of the external situation that are important for... [the object]” 15.
Thus, the essence of the cognitive approach is, as already mentioned, to help the expert reflect on the situation and develop the most effective management strategy, based not so much on his intuition, but on ordered and verified (as far as possible) knowledge about a complex system. Examples of using cognitive analysis to solve specific problems will be discussed below in paragraph “8. Using a Cognitive Model."
3. Stages of cognitive analysis
Cognitive analysis consists of several stages, at each of which a specific task is implemented. The consistent solution of these problems leads to the achievement of the main goal of cognitive analysis. Researchers give different nomenclature of stages depending on the specifics of the object(s) being studied 16 . If we summarize and generalize all these approaches, we can identify the following stages that are characteristic of the cognitive analysis of any situation.- Formulation of the purpose and objectives of the study.
Studying a complex situation from the perspective of the set goal: collecting, systematizing, analyzing existing statistical and qualitative information regarding the control object and its external environment, determining the requirements, conditions and limitations inherent in the situation under study.
Identification of the main factors influencing the development of the situation.
Determining the relationship between factors by considering cause-and-effect chains (constructing a cognitive map in the form of a directed graph).
Studying the strength of mutual influence of different factors. For this purpose, both mathematical models are used that describe some precisely identified quantitative relationships between factors, and the expert’s subjective ideas regarding unformalized qualitative relationships between factors.
- Checking the adequacy of a cognitive model of a real situation (verification of a cognitive model).
Determination, using a cognitive model, of possible options for the development of a situation (system) 17, discovery of ways, mechanisms of influencing the situation in order to achieve the desired results, prevent undesirable consequences, that is, developing a management strategy. Setting target, desired directions and the strength of changing process trends in the situation. Selecting a set of measures (a set of control factors), determining their possible and desired strength and direction of impact on the situation (specific practical application of the cognitive model).
4. Goals, stages and basic concepts of cognitive modeling
The key element of cognitive analysis is the construction of a cognitive model.
4. 1. The purpose of building a cognitive model
Cognitive modeling contributes to a better understanding of the problem situation, identification of contradictions and qualitative analysis of the system. The purpose of modeling is to form and clarify a hypothesis about the functioning of the object under study, considered as a complex system that consists of separate, but still interconnected elements and subsystems. In order to understand and analyze the behavior of a complex system, a structural diagram of the cause-and-effect relationships of the system elements is built. Analysis of these connections is necessary for the implementation of various process controls in the system 18.4.2. Stages of cognitive modeling
In general terms, the stages of cognitive modeling are discussed above. The works of specialists from the IPU RAS contain a detailed description of these stages. Let us highlight the main ones.- Identification of factors characterizing the problem situation, development of the system (environment). For example, the essence of the problem of tax non-payments can be formulated in the factors “Tax non-payments”, “Tax collection”, “Budget revenues”, “Budget expenses”, “Budget deficit”, etc.
Identification of connections between factors. Determining the direction of influences and mutual influences between factors. For example, the factor “Level of tax burden” affects “Non-payment of taxes”.
Determining the nature of the influence (positive, negative, +\-) For example, an increase (decrease) in the factor “Level of tax burden” increases (decreases) “Non-payment of taxes” - a positive impact; and an increase (decrease) in the factor “Tax Collection” reduces (increases) “Non-payment of taxes” - a negative impact. (At this stage, a cognitive map is constructed in the form of a directed graph.)
Determining the strength of influence and mutual influence of factors (weak, strong) For example, an increase (decrease) in the factor “Level of tax burden” “significantly” increases (decreases) “Non-payment of taxes” 19 (Final construction of a cognitive model in the form of a functional graph).
Problems of identifying factors, assessing the mutual influence of factors and typology of factors will be discussed in paragraphs 5 and 6; Here we will consider such basic concepts of cognitive modeling as a cognitive map and a functional graph.
4.3. Directed graph (cognitive map)
Within the framework of the cognitive approach, the terms “cognitive map” and “directed graph” are often used interchangeably; although, strictly speaking, the concept of a directed graph is broader, and the term “cognitive map” indicates only one of the applications of a directed graph.A cognitive map consists of factors (elements of the system) and connections between them.
In order to understand and analyze the behavior of a complex system, a structural diagram of cause-and-effect relationships of system elements (situation factors) is constructed. Two elements of the system A and B are depicted on the diagram as separate points (vertices) connected by an oriented arc, if element A is connected to element B by a cause-and-effect relationship: A a B, where: A is the cause, B is the effect.
Factors can influence each other, and such influence, as already indicated, can be positive, when an increase (decrease) in one factor leads to an increase (decrease) in another factor, and negative, when an increase (decrease) in one factor leads to a decrease (increase). ) another factor 20 . Moreover, the influence may also have a variable sign depending on possible additional conditions.
Similar schemes for representing cause-and-effect relationships are widely used to analyze complex systems in economics and sociology.
An example of a cognitive map of some economic situation is shown in Fig. 1.
Figure 1. Directed graph 21.
4.4. Functional graph (completing the construction of a cognitive model)
A cognitive map reflects only the fact that factors influence each other. It does not reflect the detailed nature of these influences, nor the dynamics of changes in influences depending on changes in the situation, nor temporary changes in the factors themselves. Taking into account all these circumstances requires a transition to the next level of information structuring, that is, to a cognitive model.
At this level, each connection between the factors of the cognitive map is revealed by corresponding dependencies, each of which can contain both quantitative (measurable) variables and qualitative (non-measured) variables. In this case, quantitative variables are presented naturally in the form of their numerical values. Each qualitative variable is associated with a set of linguistic variables that reflect the different states of this qualitative variable (for example, consumer demand can be “weak”, “moderate”, “exciting”, etc.), and each linguistic variable corresponds to a certain numerical equivalent in scale. As knowledge accumulates about the processes occurring in the situation under study, it becomes possible to reveal in more detail the nature of the connections between factors.
Formally, a cognitive model of a situation can, like a cognitive map, be represented by a graph, but each arc in this graph already represents a certain functional relationship between the corresponding factors; those. the cognitive model of the situation is represented by a functional graph 22.
An example of a functional graph reflecting the situation in a conditional region is presented in Fig. 2.
Figure 2. Functional graph 23.
Note that this model is a demonstration model, so many environmental factors are not taken into account.
5. Types of factors
To structure a situation (system), researchers divide factors (elements) into various groups, each of which has certain specifics, namely a functional role in modeling. Moreover, depending on the specifics of the analyzed situation (system), the typology of factors (elements) may be different. Here I will highlight some types of factors used in cognitive modeling of most systems (situations, environments).
Firstly, among all the detected factors, basic factors (those that significantly influence the situation and describe the essence of the problem) and “redundant” (insignificant) factors that are “weakly connected” with the “core” of basic factors 24 are distinguished.
When analyzing a specific situation, an expert usually knows or assumes what changes in basic factors are desirable for him. The factors of greatest interest to the expert are called target factors. IN AND. Maksimov, E.K. Kornoushenko, S.V. Kachaev describes the target factors as follows: “These are the “output” factors of the cognitive model. The task of developing solutions for managing processes in a situation is to ensure the desired changes in target factors; this is the goal of management. A goal is considered correctly set if desired changes in some target factors do not lead to undesirable changes in other target factors” 25.
In the initial set of basic factors, a set of so-called control factors is identified - “input” factors of the cognitive model, through which control influences are supplied to the model. A control action is considered consistent with the goal if it does not cause undesirable changes in any of the target factors” 26. To identify control factors, factors influencing the target ones are determined. The control factors in the model will be potential levers of influence on the situation 27 .
The influence of control factors is summarized in the concept of “vector of control actions” - a set of factors, each of which is supplied with a control pulse of a given value 28 .
Factors of the situation (or elements of the system) can also be divided into internal (belonging to the control object itself and under more or less complete control of management) and external (reflecting the impact on the situation or system of external forces that may not be controlled or only indirectly controlled by the subject of control) .
External factors are usually divided into predictable ones, the occurrence and behavior of which can be predicted based on the analysis of available information, and unpredictable ones, the behavior of which an expert learns about only after their occurrence 29 .
Sometimes researchers identify so-called indicator factors that reflect and explain the development of processes in a problem situation (system, environment) 30 . For similar purposes, the concept of integral indicators (factors) is also used, by changes in which one can judge general trends in this area 31 .
Factors are also characterized by a tendency to change their values. The following trends are distinguished: growth, decline. If there is no change in the factor, it is said that there is no trend or a zero trend 32 .
Finally, it should be noted that it is possible to identify causal factors and effect factors, short-term and long-term factors.
6. Main problems of constructing a cognitive model
There are two main problems in constructing a cognitive model.
Firstly, difficulties are caused by identifying factors (elements of the system) and ranking factors (selecting basic and secondary ones) (at the stage of constructing a directed graph).
Secondly, identifying the degree of mutual influence of factors (determining the weights of the graph arcs) (at the stage of constructing a functional graph).
6.1. Identification of factors (elements of the system)
It can be stated that researchers have not developed a clear algorithm for identifying the elements of the systems under study. It is assumed that the situation factors being studied are already known to the expert conducting the cognitive analysis.Usually, when considering large (for example, macroeconomic) systems, the so-called PEST analysis is used (Policy - politics, Economy - economics, Society - society, Technology - technology), which involves identifying 4 main groups of factors through which political, economic, sociocultural and technological aspects of the environment 33. This approach is well known in all socio-economic sciences.
PEST analysis is a tool for the historically established four-element strategic analysis of the external environment. Moreover, for each specific complex object there is its own special set of key factors that directly and most significantly affect the object. The analysis of each of the identified aspects is carried out systematically, since in life all these aspects are closely interconnected 34 .
In addition, it is assumed that the expert can judge the nomenclature of factors in accordance with his subjective ideas. Thus, “Fundamental” analysis of financial situations, close in some parameters to cognitive analysis, is based on a set of basic factors (financial and economic indicators) - both macroeconomic and lower order, both long-term and short-term. These factors, in accordance with the “fundamental” approach, are determined on the basis of common sense 35.
Thus, the only conclusion that can be drawn regarding the process of identifying factors is that the analyst, in pursuit of this goal, must be guided by ready-made knowledge of various socio-economic sciences involved in the specific study of various systems, as well as his experience and intuition.
6.2. Two approaches to identifying relationships between factors
To reflect the nature of the interaction of factors, positive and normative approaches are used.The positive approach is based on taking into account the objective nature of the interaction of factors and allows us to draw arcs, assign signs (+ / -) and exact weights to them, that is, reflect the nature of this interaction. This approach is applicable if the relationship between factors can be formalized and expressed by mathematical formulas that establish precise quantitative relationships.
However, not all real systems and their subsystems are described by one or another mathematical formula. We can say that only some special cases of interaction of factors have been formalized. Moreover, the more complex the system, the less likely it is to be fully described using traditional mathematical models. This is primarily due to the fundamental properties of unstable, weakly structured systems described in paragraph 1. Therefore, the positive approach is complemented by the normative one.
The normative approach is based on a subjective, evaluative perception of the interaction of factors, and its use also makes it possible to assign weights to the arcs, i.e., reflect the strength (intensity) of the interaction of factors. Determining the influence of factors on each other and assessing these influences are based on the expert’s “estimates” and are expressed quantitatively using the [-1,1] scale or linguistic variables such as “strong”, “weak”, “moderate” 36. In other words, with a normative approach, the expert is faced with the task of intuitively determining the strength of the mutual influence of factors, based on his knowledge of the qualitative relationship.
In addition, as already mentioned, the expert needs to determine the negative or positive nature of the influence of the factors, and not just the strength of the influence. When carrying out this task, it is obviously possible to use the two approaches mentioned above.
6.3.Examples of identifying factors and connections between them
Let us give some examples used by researchers to illustrate the identification of factors and the establishment of connections between them.
Thus, V. Maksimov, S. Kachaev and E. Kornoushenko, to build a cognitive model of the processes occurring in a crisis economy, identify the following basic factors: 1. Gross domestic product (GDP); 2. Aggregate demand; 3. Inflation; 4. Savings; 5. Consumption; 6. Investments; 7. Government procurement; 8. Unemployment; 9. Supply of money; 10. Government transfer payments; 11. Government expenditures; 12. Government revenues; 13. State budget deficit; 14. Taxes; 15. Non-payment of taxes; 16. Interest rate; 17. Demand for money 37.
V. Maksimov, E. Grebenyuk, E. Kornoushenko in the article “Fundamental and technical analysis: integration of two approaches” give another example of identifying factors and reveal the nature of the connections between them: “The most important economic indicators that influence the stock market in the USA and Europe are are: gross national product (GNP), industrial output index (PPI), consumer price index (CPI), producer price index (PPI), unemployment rate, oil price, dollar exchange rate... If the market is growing and economic indicators confirm stable economic development , then we can expect a further rise in prices... Shares rise in price if the company's profits are growing and there is a prospect for their further growth... If the actual growth rates of economic indicators diverge from the expected ones, this leads to panic in the stock market and its sharp changes. The change in gross national product is normally 3-5% per year. If the annual growth of GNP exceeds 5%, then this is called an economic boom, which can ultimately lead to a market crash. Changes in GNP can be predicted by changes in the manufacturing industry index. A sharp increase in the IPI indicates a possible increase in inflation, which leads to a fall in the market. An increase in the CPI and PPI and oil prices also leads to a fall in the market. High unemployment rates in the United States and Europe (over 6%) force federal agencies to lower the bank interest rate, which leads to a revival of the economy and a rise in stock prices. If unemployment decreases gradually, the market does not react to these changes. If its level drops sharply and becomes less than the expected value, then the market begins to fall, because a sharp decrease in unemployment can increase the level of inflation beyond the expected level” 38.
6.4. The problem of determining the strength of influence of factors
So, the most important problem of cognitive modeling is identifying the weights of graph arcs - that is, quantitative assessment of the mutual influence or influence of factors. The fact is that the cognitive approach is used when studying an unstable, weakly structured environment. Let us recall that its characteristics are: variability, difficulty in formalizing, multi-factorial nature, etc. This is the specificity of all systems in which people are included. Therefore, the inoperability of traditional mathematical models in many cases is not a methodological defect of cognitive analysis, but a fundamental property of the subject of research 39 .
Thus, the most important feature of most situations studied in management theory is the presence of thinking participants in them, each of whom represents the situation in their own way and makes certain decisions based on “their” perception. As J. Soros noted in his book “The Alchemy of Finance,” “When there are thinking participants in a situation, the sequence of events does not lead directly from one set of factors to another; instead, it cross-cuts...connects factors to their perceptions and perceptions to factors.” This leads to the fact that “the processes in the situation do not lead to equilibrium, but to a never-ending process of change” 40. It follows that a reliable prediction of the behavior of processes in a situation is impossible without taking into account the assessment of this situation by its participants and their own assumptions about possible actions. J. Soros called this feature of some systems reflexivity.
Formalized quantitative dependencies of factors are described by different formulas (patterns), depending on the subject of the study, that is, on the factors themselves. However, as already mentioned, building a traditional mathematical model is not always possible.
The problem of universal formalization of the mutual influence of factors has not yet been solved and is unlikely to ever be solved.
Therefore, it is necessary to come to terms with the fact that it is not always possible to describe the relationships of factors with mathematical formulas, i.e. It is not always possible to accurately quantify the dependencies 41 .Therefore, in cognitive modeling, when estimating the weights of arcs, as mentioned, the subjective opinion of the expert is often taken into account 42. The main task in this case is to compensate for subjectivity and distortion of assessments through various types of verification procedures.
In this case, it is usually not enough to simply check the expert’s assessments for consistency. The main goal of the procedure for processing the subjective opinions of an expert is to help him reflect, more clearly understand and systematize his knowledge, evaluate its consistency and adequacy to reality.
In the process of extracting expert knowledge, there is an interaction between the expert - the source of knowledge - and a cognitive scientist (knowledge engineer) or with a computer program, which makes it possible to follow the course of reasoning of specialists when making decisions and to identify the structure of their ideas about the subject of research 43 .The procedures for testing and formalizing an expert’s knowledge are described in more detail in the article by A.A. Kulinich “Cognitive modeling system “Canva”” 44.
7. Checking the adequacy of the model
Researchers have proposed several formal procedures for checking the adequacy of the constructed model 45 . However, since the model is not built only on formalized relationships between factors, mathematical methods for checking its correctness do not always provide an accurate picture. Therefore, the researchers proposed a kind of “historical method” to test the adequacy of the model. In other words, the developed model of a situation is applied to similar situations that existed in the past and the dynamics of which are well known 46 . If the model turns out to be operational (that is, it produces forecasts that coincide with the actual course of events), it is recognized as correct. Of course, no single method of model verification is exhaustive, so it is advisable to use a set of procedures for verifying correctness.
8. Using a cognitive model
8.1. Application of cognitive models in decision support systemsThe main purpose of the cognitive model is to help the expert in the process of cognition and, accordingly, develop the right decision. Therefore, the cognitive approach is used in decision support systems.
The cognitive model visualizes and organizes information about the environment, intent, goals, and actions. At the same time, visualization performs an important cognitive function, illustrating not only the results of the actions of the subject of management, but also suggesting to him ways to analyze and generate decision options 47 .
However, the cognitive model serves not only to systematize and “clarify” the expert’s knowledge, but also to identify the most advantageous “points of application” of the control actions of the subject of management 48 . In other words, the cognitive model explains which factor or relationship of factors needs to be influenced, with what force and in what direction in order to obtain the desired change in target factors, that is, to achieve the management goal at the lowest cost.
Control actions can be short-term (impulse) or long-term (continuous), acting until the goal is achieved. It is also possible to use pulsed and continuous control actions together 49 .
When a given goal is achieved, the task immediately arises of maintaining the situation in the achieved favorable state until a new goal appears. In principle, the task of maintaining the situation in the required state is no different from the task of achieving a goal 50.
A complex of interrelated control influences and their logical time sequence constitute a holistic management strategy (control model).
The use of different management models can lead to different results. Here it is important to be able to predict what consequences this or that management strategy will ultimately lead to.
To develop such forecasts, a scenario approach (scenario modeling) is used within the framework of cognitive analysis. Scenario modeling is sometimes called "dynamic simulation".
The scenario approach is a kind of “playing out” different options for the development of events depending on the chosen management model and the behavior of unpredictable factors. For each scenario, a triad is built: “initial premises - our impact on the situation - the result obtained” 51. In this case, the cognitive model makes it possible to take into account the entire complex of effects of control actions for different factors, the dynamics of factors and their relationships under different conditions.
Thus, all possible options for the development of the system are identified and proposals are developed regarding the optimal management strategy for implementing the desired scenario from among the possible ones 52 .
Researchers quite often include scenario modeling among the stages of cognitive analysis or consider scenario modeling as an addition to cognitive analysis.
If we summarize and generalize the opinions of researchers regarding the stages of scenario modeling, then in the most general form the stages of scenario analysis can be presented as follows.
1. Development of management goals (desired changes in target factors).
2. Development of scenarios for the development of the situation when applying different management strategies.
3. Determining the achievability of the goal (the feasibility of scenarios leading to it); checking the optimality of the already planned management strategy (if any); choosing the optimal strategy that corresponds to the best scenario from the point of view of the goal.
4. Concretization of the optimal management model - development of specific practical recommendations for managers. This specification includes identifying control factors (through which it is possible to influence the development of events), determining the strength and direction of control influences on control factors, predicting probable crisis situations due to the influence of unpredictable external factors, etc.
It should be noted that the stages of scenario modeling may vary depending on the object of study and management.
At the initial stage of modeling, there may be enough qualitative information that does not have an exact numerical value and reflects the essence of the situation. When moving to modeling specific scenarios, the use of quantitative information, which represents numerical estimates of the values of any indicators, becomes increasingly important. In the future, mainly quantitative information 53 is used to carry out the necessary calculations.
The very first scenario, which does not require any action by the researcher to form it, is the self-development of the situation (in this case, the vector of control actions is “empty”). Self-development of the situation is the starting point for further formation of scenarios. If the researcher is satisfied with the results obtained during self-development (in other words, if the set goals are achieved during self-development), then further scenario research comes down to studying the impact of certain changes in the external environment on the situation 54 .
There are two main classes of scenarios: scenarios that simulate external influences and scenarios that simulate the targeted (controlled) development of the situation 55 .
8.2. An example of working with a cognitive model
Let's consider an example of working with a cognitive model given in the article by S.V. Kachaeva and D.I. Makarenko “Integrated information and analytical complex for situational analysis of the socio-economic development of the region.”“The use of an integrated information and analytical complex of situational analysis can be considered using the example of developing a strategy and program for the socio-economic development of the region.
At the first stage, a cognitive model of the socio-economic situation in the region is built... Next, scenarios of the potential and real possibility of changing the situation in the region and achieving the set goals are modeled.
The following were chosen as the goals of socio-economic policy:
- increase in production volumes
improving the standard of living of the region's population
reduction of budget deficit
- income of the population;
investment climate;
production costs;
development of production infrastructure;
tax collection;
tax benefits;
political and economic preferences for the region.
Figure 3. Cognitive and dynamic simulation (scenario) modeling.
At the next stage, they move from developing a strategy for achieving goals to developing a program of specific actions. The tool for implementing the strategy is regional budget and tax policy.
The levers and certain impacts selected at the previous stage correspond to the following directions of budget and tax policy.
| Levers of achievement strategic goals |
Directions of budget and tax policy |
| Income of the population |
Expenditures on social policy |
| Investment climate |
Government expenses Law enforcement expenses Expenses for industry, power generation, construction and agriculture |
| Production costs |
Regulation of tariffs for electricity, fuel, heat, rent, etc. |
| Development of production infrastructure |
Development of market infrastructure |
| Tax collection |
Regulating the level of tax non-payments |
| Tax benefits |
Regulating the level of tax benefits |
| Political and economic preferences for the region. |
Free transfers from other levels of government |
Thus, an integrated information and analytical complex of situational analysis is a powerful tool for developing a regional development strategy and implementing this strategy” 56 .
It should be noted that in studies, examples of the use of cognitive and scenario modeling are usually given in a very general form, since, firstly, this kind of information is exclusive and has a certain commercial value, and, secondly, each specific situation (system, environment, control object) requires an individual approach.
The existing theoretical basis of cognitive analysis, although it requires clarification and development, allows different management subjects to develop their own cognitive models, since, as mentioned, it is assumed that specific models are compiled for each area, for each problem.
9. Computer systems to support management decisions
Conducting cognitive analysis of unstable, weakly structured situations and environments is an extremely difficult task, for the solution of which information systems are involved. Essentially, these systems are designed to improve the efficiency of the decision-making mechanism, since the main applied task of cognitive analysis is control optimization.9.1. General characteristics of decision support systems
Decision support systems are usually interactive. They are designed to process data and implement models that help solve individual, mostly weakly or unstructured problems (for example, making investment decisions, making forecasts, etc.). These systems can provide workers with the information needed to make individual and group decisions. Such systems provide immediate access to information reflecting current situations and all the factors and connections necessary for decision making 57
etc.................
 Assessing the effectiveness of scientific research
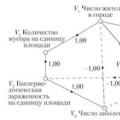 Medium-term forecasting of the Russian economy using a cognitive model
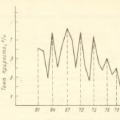 Innovation and structural changes in the economy