Types of measuring scales. Measuring scales Absolute measurement scale
In system analysis, there is a section called “theory of efficiency”, which is associated with determining the quality of systems and processes that implement them. Efficiency theory is a scientific direction, the subject of study of which is the issues of quantitative assessment of the quality of characteristics and the efficiency of functioning of complex systems.
The assessment of complex systems can be carried out for different purposes:
4) for optimization - choosing the best algorithm from several that implement one law of system operation;
5) for identification - determining the system whose quality most closely matches the real object under given conditions;
6) to make decisions on system management.
Common to all such tasks is the approach based on the fact that the concepts of “assessment” and “assessment” are considered separately and the assessment is carried out in several stages. Under assessment understand the result obtained during a process, which is defined as assessment. Those. the term “evaluation” is compared with the concept of “truth”, and with the term “evaluation” - “correctness”. True evaluation can only be achieved through a proper evaluation process. This position determines the place of efficiency theory in the problems of system analysis.
There are four stages in assessing complex systems.
Stage 1. Determine the purpose of the assessment. There are two types of goals: qualitative and quantitative, the achievement of which is expressed in appropriate scales. The definition of the goal must be carried out in relation to the system in which the system in question is an element (subsystem).
Stage 2. Measuring the properties of systems recognized as significant for assessment purposes. To do this, appropriate scales for measuring properties are selected and all studied properties of systems are assigned a certain value on these scales.
Stage 3. Justification of preferences for quality criteria and performance criteria for systems based on properties measured on selected scales.
Stage 4. The actual assessment. All systems under study, considered as alternatives, are compared according to formulated criteria and, depending on the evaluation purposes, are ranked, selected, optimized, etc.
2.1.1. Concept of scale
The assessment is based on the process of comparing the values of qualitative or quantitative characteristics of the system under study with the values of the corresponding scales. The study of the characteristics led to the conclusion that all possible scales belong to one of several types, determined by the list of permissible operations on these scales.
Formally, a scale is a tuple of three elements
Modern measurement theory defines:
X={x 1 ,X 2 ,…x i,…, x n,R x) - an empirical system with a relation, including many properties x i, on which, in accordance with measurement purposes, a certain ratio is specified Rx. During the measurement process, each property needs x iÎ X match the sign or number that characterizes it. If, for example, the purpose of measurement is choice, then the elements x i are considered as alternatives, and the attitude R x allows you to compare these alternatives; Y={j(x 1),…, j(x n), R y) a sign system with a relation, which is a reflection of the empirical system in the form of some figurative or numerical system corresponding to the measured empirical system; jО Ф - homomorphic mapping X on Y, establishing correspondence between X And Y So ( j(x 1),…, j(x n), R y}Î Ry only when ( X 1 ,..., x p,) Î R x.
The type of scale is determined by the set of admissible transformations Ф .
In accordance with the given definitions, covering both quantitative and qualitative scales, the measurement of an empirical system X with attitude R x consists in defining the sign system Y with attitude R, corresponding to the system being measured. Preferences R x on a set X´ X as a result, measurements are translated into signed (including quantitative) relationships Ry on a set Y´ Y.
2.1.2. Nominal type scales
The weakest quality scale is nominal (scale of names, classification scale), by which objects or their indistinguishable groups are given some attribute. The name “nominal” is explained by the fact that such a sign gives only unrelated names to objects. Scales of nominal type are specified by a set of one-to-one admissible transformations of scale values. These values are either the same or different for different objects; no more subtle relationships between values are recorded. The main property of these scales is the preservation of unchanged relations of equality between the elements of the empirical system in equivalent scales.
Examples of measurements in the nominal type of scales include car numbers, telephone numbers, city codes, persons, objects, etc. The only purpose of such measurements is to identify differences between objects of different classes. If each class consists of one object, a naming scale is used to distinguish objects.
Figure 2.1 shows the measurement on a nominal scale of objects representing three sets of elements A, B, C. Here the empirical system is represented by four elements: AÎ A, bÎ B, (s, d) OS. The sign system is represented by a digital scale of names, including elements 1, 2,..., n and preserving the relation of equality. Homomorphic mapping φ assigns each element from the empirical system a certain element of the sign system. Nominal scales have two features:
Any processing of measurement results on a nominal scale must take these features into account. Otherwise, erroneous conclusions may be made regarding the assessment of systems that do not correspond to reality.
2.1.3. Order scales
The scale is called rank (order scale), if the set Ф consists of all monotonically increasing admissible transformations of scale values.
Such a transformation is called monotonically increasing φ (X), which satisfies the condition: if X 1 > X 2, then φ (X 1) > φ (X 2) for any scale values from the definition area. The ordinal type of scales allows not only the distinction of objects, like the nominal type, but is also used to order objects according to measured properties.
Situations for using the ranking scale:
It is necessary to organize objects in time or space. At the same time, they are not interested in comparing the degree of expression of any of their qualities, but only in the relative spatial or temporal arrangement of objects;
It is necessary to arrange objects in accordance with some quality, but there is no need to accurately measure it;
A quality is, in principle, measurable, but cannot currently be measured for practical or theoretical reasons.
Examples of order scales: the scale of mineral hardness, proposed in 1811 by the German scientist F. Mohs and still common in geological field work; scales of wind strength, earthquake strength, grades of goods in trade, sociological scales, etc.
Any scale derived from an order scale S using an arbitrary monotonically increasing transformation of scale values, will also be an exact order scale for the original empirical system with relations.
2.1.4. Interval scales
One of the most important types of scales is the type intervals. This type contains scales that are unique up to a set of positive linear admissible transformations of the form φ (X) = ax + b, Where XÎ Y Y; a > 0; b- any value.
The main property of these scales is that the ratios of intervals in equivalent scales remain unchanged: 
Examples of using interval scales:
1) Temperature scales. The transition from one scale to an equivalent one, for example from the Celsius scale to the Fahrenheit scale, is specified by a linear transformation of scale values:
t°F = 1.8 t°C + 32.
2) Measuring the attribute “date of the event”, since to measure time on a specific scale it is necessary to fix the scale and origin. The Gregorian and Muslim calendars are two instantiations of interval scales.
When moving to equivalent scales using linear transformations in interval scales, a change occurs as the origin (parameter b), and the measurement scale (parameter A).
Interval scales, like nominal and ordinal scales, preserve the distinction and ordering of the objects being measured. However, in addition to this, they also preserve the relation of distances between pairs of objects. Record  means that the distance between X 1 and X 2 in K times the distance between X 3 and X 4 and in any equivalent scale this value (the ratio of the differences in numerical estimates) will be preserved. In this case, the relations between the estimates themselves are not preserved.
In sociological research, interval scales usually measure the temporal and spatial characteristics of objects. For example, dates of events, length of service, age, time for completing tasks, differences in marks on a graphic scale, etc. However, directly identifying the measured variables with the property being studied is not so simple.
A common mistake is to take properties measured on an interval scale as indicators of other properties that are monotonically related to the data.
When used to measure related properties, the original interval scales become merely order scales. Ignoring this fact leads to incorrect results.
2.1.5. Attitude scales
Relationship scale (similarity) is called a scale if Ф consists of similarity transformations j(x) = ax, a>0, where XÎ Y- scale values from the domain of definition Y; A - real numbers. In ratio scales, the ratios of numerical estimates of objects remain unchanged:  .
.
Examples of measurements in ratio scales are measurements of the mass and length of objects. When establishing mass, a wide variety of numerical estimates are used: when measuring in kilograms, we get one numerical value, when measuring in pounds, another, etc. However, no matter what system of units the mass is measured in, the ratio of the masses of any objects is the same and does not change when moving from one numerical system to another, equivalent one. Measuring distances and lengths of objects has the same property.
Ratio scales reflect the relationships between properties of objects, i.e. how many times a property of one object exceeds the same property of another object.
Ratio scales form a subset of interval scales by fixing the zero value of the parameter b: b= 0. This corresponds to setting the zero point of reference for scale values for all ratio scales. The transition from one scale of relations to another scale equivalent to it is carried out using similarity (stretching) transformations, i.e. changing the measurement scale. Ratio scales, being a special case of interval scales, when choosing a zero reference point, preserve not only the relations of the properties of objects, but also the relations of distances between pairs of objects.
2.1.6. Difference scales
Difference scales are defined as scales that are unique up to shift transformations φ (X) = x + b, Where XÎ Y scale values from the domain of definition Y; b- real numbers. Those. When moving from one numerical system to another, only the starting point changes. Difference scales are used in cases where it is necessary to measure how much one object is superior to another object in a certain property. In the difference scales, the differences in numerical estimates of properties remain unchanged: φ (X 1) - φ (X 2) = X 1 - X 2 .
Examples of measurements in difference scales:
3) Measuring the increase in enterprise production (in absolute units) in the current year compared to the last;
4) Increase in the number of institutions, the number of equipment purchased per year, etc.
5) Calculation of years (in years). The transition from one chronology to another is carried out by changing the starting point.
Difference scales are a special case of interval scales obtained by fixing the parameter A: (A= 1), i.e. choosing a measurement scale unit. The starting point in difference scales can be arbitrary. Difference scales preserve the ratio of intervals between estimates of pairs of objects, but, unlike the ratio scale, they do not preserve the ratio of evaluations of the properties of objects.
2.1.7. Absolute scales
Absolute are called scales in which the only admissible transformations Φ are identical transformations: φ (X) = {e), Where e(x) = x.
This means that there is only one mapping of empirical objects into a numerical system. The uniqueness of measurement is understood in a literal absolute sense.
Absolute scales are used, for example, to measure the number of objects, objects, events, decisions, etc. Natural numbers are used as scale values when measuring the number of objects when objects are represented by whole units, and real numbers if, in addition to whole units, parts of objects are also present.
Absolute scales are a special case of all previously considered types of scales, therefore they preserve any relationship between the numbers of estimates of the measured properties of objects: difference, order, ratio of intervals, ratio and difference of values, etc.
In addition to those indicated, there are intermediate types of scales, for example, power scale φ(x)= ah b ; A>0, b>0, A#1, b No. 1, and its variant logarithmic scale φ(x)= xb; b>0, b#1.

For clarity, let us depict the relationships between the main types of scales in the form of a hierarchical structure of the main scales (Fig. 2.2). The arrows indicate the inclusion of sets of admissible transformations from more “strong” to less “strong” types of scales. Moreover, the scale is “stronger” the less freedom in choice φ(x). Some scales are isomorphic, i.e. equivalent. For example, the interval scale and the power scale are equivalent. The logarithmic scale is equivalent to the difference scale and the ratio scale.
Measurement scales
In practical activities, it is necessary to carry out measurements of various quantities that characterize the properties of bodies, substances, phenomena and processes. As was shown in the previous sections, some properties appear only qualitatively, others - quantitatively. Various manifestations (quantitative or qualitative) of any property form sets, the mappings of whose elements onto an ordered set of numbers or, in a more general case, conventional signs form measurement scales these properties. The quantitative property measurement scale is the PV scale. Physical quantity scale is an ordered sequence of PV values, adopted by agreement based on the results of accurate measurements. The terms and definitions of the theory of measurement scales are set out in document MI 2365-96.
In accordance with the logical structure of the manifestation of properties, five main types of measurement scales are distinguished.
1. Naming scale (classification scale). Such scales are used to classify empirical objects whose properties appear only in relation to equivalence. These properties cannot be considered physical quantities, therefore scales of this type are not PV scales. This is the simplest type of scale, based on assigning numbers to the qualitative properties of objects, playing the role of names.
In naming scales in which the assignment of a reflected property to a particular equivalence class is carried out using human senses, the most adequate result is the one chosen by the majority of experts. In this case, the correct choice of classes of the equivalent scale is of great importance - they must be reliably distinguished by observers and experts assessing this property. The numbering of objects on a scale of names is carried out according to the principle: “do not assign the same number to different objects.” Numbers assigned to objects can be used to determine the probability or frequency of occurrence of a given object, but they cannot be used for summation or other mathematical operations.
Since these scales are characterized only by equivalence relations, they do not contain the concepts of zero, “more” or “less” and units of measurement. An example of naming scales are widely used color atlases designed for color identification.
2. Order scale (rank scale). If the property of a given empirical object manifests itself in relation to equivalence and order in increasing or decreasing quantitative manifestation of the property, then an order scale can be constructed for it. It is monotonically increasing or decreasing and allows you to establish a greater/lesser ratio between quantities characterizing the specified property. In order scales, zero exists or does not exist, but in principle it is impossible to introduce units of measurement, since a proportionality relation has not been established for them and, accordingly, there is no way to judge how many times more or less specific manifestations of a property are.
In cases where the level of knowledge of a phenomenon does not allow one to accurately establish the relationships that exist between the values of a given characteristic, or the use of a scale is convenient and sufficient for practice, conditional (empirical) order scales are used. Conditional scale is a PV scale, the initial values of which are expressed in conventional units. For example, the Engler viscosity scale, the 12-point Beaufort scale for sea wind strength.
Order scales with reference points marked on them have become widespread. Such scales, for example, include the Mohs scale for determining the hardness of minerals, which contains 10 reference (reference) minerals with different hardness numbers: talc - 1; gypsum - 2; calcium - 3; fluorite - 4; apatite - 5; orthoclase - 6; quartz - 7; topaz - 8; corundum - 9; diamond - 10. The assignment of a mineral to a particular gradation of hardness is carried out on the basis of an experiment, which consists of scratching the test material with a supporting one. If after scratching the tested mineral with quartz (7) a trace remains on it, but after orthoclase (6) there is no trace, then the hardness of the tested material is more than 6, but less than 7. It is impossible to give a more accurate answer in this case.
In conventional scales, the same intervals between the sizes of a given quantity do not correspond to the same dimensions of the numbers displaying the sizes. Using these numbers you can find probabilities, modes, medians, quantiles, but they cannot be used for summation, multiplication and other mathematical operations.
Determining the value of quantities using order scales cannot be considered a measurement, since units of measurement cannot be entered on these scales. The operation of assigning a number to the required value should be considered assessment. Assessment on order scales is ambiguous and very conditional, as evidenced by the example considered.
3. Interval scale (difference scale). These scales are a further development of order scales and are used for objects whose properties satisfy the relations of equivalence, order and additivity. The interval scale consists of identical intervals, has a unit of measurement and an arbitrarily chosen beginning - the zero point. Such scales include chronology according to various calendars, in which either the creation of the world, or the Nativity of Christ, etc. is taken as the starting point. The Celsius, Fahrenheit and Reaumur temperature scales are also interval scales.
The interval scale defines the actions of adding and subtracting intervals. Indeed, on a time scale, intervals can be summed or subtracted and compared by how many times one interval is greater than another, but adding up the dates of any events is simply pointless.
The Q interval scale is described by the equation
where q is the numerical value of the quantity; - start of the scale; - unit of the quantity under consideration. Such a scale is completely determined by specifying the starting point of the scale and the unit of the given value.
There are practically two ways to set the scale. In the first of them, two values and quantities are selected that are relatively simply implemented physically. These values are called reference points, or main rappers and interval() - main interval. The point is taken as the origin, and the value  per unit Q. In this case, n is chosen such that it is an integer value.
Translation of one interval scale ![]() , to another
, to another ![]() carried out according to the formula
carried out according to the formula
 (2.2)
(2.2)
The numerical value of the interval between the starting points on the scales under consideration, measured in degrees Fahrenheit ( ![]() , equals 32. The transition from temperature on the Fahrenheit scale to temperature on the Celsius scale is carried out according to the formula
, equals 32. The transition from temperature on the Fahrenheit scale to temperature on the Celsius scale is carried out according to the formula  .
.
In the second way of specifying the scale, the unit is reproduced directly as an interval, a certain fraction of it, or a certain number of intervals of the size of a given value, and the starting point is chosen differently each time depending on the specific conditions of the phenomenon being studied. An example of this approach is a time scale in which 1 s = 9,192,631,770 periods of radiation corresponding to the transition between two hyperfine levels of the ground state of the cesium-133 atom. The beginning of the phenomenon under study is taken as the reference point.
4. Relationship scale . These scales describe the properties of empirical objects that satisfy the relations of equivalence, order and additivity (scales of the second kind are additive), and in some cases proportionality (scales of the first kind are proportional). Their examples are the scale of mass (second kind), thermodynamic temperature (first kind).
In ratio scales, there is an unambiguous natural criterion for the zero quantitative manifestation of a property and a unit of measurement established by agreement. From a formal point of view, the ratio scale is an interval scale with a natural origin. All arithmetic operations are applicable to the values obtained on this scale, which is important when measuring EF.
Relationship scales are the most advanced. They are described by the equation Q = q[Q], where Q is the PV for which the scale is constructed, [Q] is its unit of measurement, q is the numerical value of the PV. The transition from one scale of relations to another occurs in accordance with the equation  .
.
5. Absolute scales. Some authors use the concept of absolute scales, by which they mean scales that have all the features of ratio scales, but additionally have a natural unambiguous definition of the unit of measurement and do not depend on the adopted system of units of measurement. Such scales correspond to relative values: gain, attenuation, etc. To form many derived units in the SI system, dimensionless and counting units of absolute scales are used.
Note that the scales of names and order are called non-metric (conceptual), and interval and ratio scales - metric (material). Absolute and metric scales belong to the category of linear. The practical implementation of measurement scales is carried out by standardizing both the scales and units of measurement themselves, and, if necessary, the methods and conditions for their unambiguous
Types and methods of measurements
Types and methods of measurements.
Measurements as experimental procedures for determining the values of measured quantities are very diverse, which is explained by the multitude of measured quantities, the different nature of their changes over time, different requirements and accuracy of measurements, etc.
Measurements, depending on the method of processing experimental data to find the result, are classified as direct, indirect, joint and cumulative.
Direct measurement – a measurement in which the desired value of a quantity is found directly from experimental data as a result of the measurement.
(Example: measuring source voltage with a voltmeter).
Indirect measurement – a measurement in which the desired value of a quantity is found on the basis of a known relationship between this quantity and quantities subjected to direct measurements.
(For example: the resistance of a resistor R is found from the equation R=U/I, into which the measured values of the voltage drop U across the resistor and the current I through it are substituted).
Joint measurements – simultaneous changes in several quantities of different names to find the relationship between them. In this case, a system of equations is solved.
(For example: determine the dependence of the resistor resistance on temperature R t = R 0 (1 + At + Bt 2); by measuring the resistance of the resistor at three different temperatures, they create a system of three equations, from which the parameters R 0 , A and B dependencies are found).
Aggregate Measurements – simultaneous measurements of several quantities of the same name, in which the desired values of the quantities are found by solving a system of equations composed of the results of direct measurements of various combinations of these quantities. (For example: measuring the resistance of resistors connected in a triangle by measuring the resistance between different vertices of the triangle; the results of three measurements determine the resistance of the resistors).
The interaction of measuring instruments with an object is based on physical phenomena, the totality of which constitutes the measurement principle, and the set of techniques for using the principle and measuring instruments is called measurement method .
The numerical value of the measured quantity is obtained by comparing it with a known quantity reproduced by a certain type of measuring instrument - measure.
Depending on the method of applying a measure of a known quantity, a distinction is made between the method of direct assessment and methods of comparison with the measure.
At direct assessment method the value of the measured quantity is determined directly from the reading device of a direct conversion measuring device, the scale of which was previously calibrated using a multi-valued measure that reproduces the known values of the measured quantity.
(Example: measuring current using an ammeter).
Comparison methods with a measure - methods in which a comparison is made of the measured value and the value of the reproducible measure.
Comparison can be direct or indirect through other quantities that are uniquely related to the first.
A distinctive feature of comparison methods is the direct participation in the measurement process of a measure of a known quantity that is homogeneous with the one being measured.
The group of methods for comparison with a measure includes the following methods: null , differential , substitution And coincidences .
At zero method measurement, the difference between the measured quantity and the known quantity or the difference between the effects produced by the measured and known quantities is reduced to zero during the measurement process, which is recorded by a highly sensitive device - a null indicator.
With high accuracy of measures reproducing a known value and high sensitivity of the null indicator, high measurement accuracy can be achieved.
(Example: measuring the resistance of a resistor using a four-arm bridge, in which the voltage drop across a resistor of unknown resistance is balanced by the voltage drop across a resistor of known resistance.)
At differential method the difference between the measured value and the value of a known, reproducible measure is measured using a measuring device.
The unknown quantity is determined from the known quantity and the measured difference. In this case, the balancing of the measured value with a known value is not carried out completely, and this is the difference between the differential method and the zero method. The differential method can also provide high measurement accuracy if the known value is reproduced with high accuracy and the difference between it and the unknown value is small.
Example: measurement of DC voltage U x using a discrete voltage divider R U and a voltmeter V
 |
Fig.1.1. Voltage measurement circuit using the differential method.
Unknown voltage U x =U 0 + U x , where U 0 is the known voltage, U x is the measured voltage difference.
At substitution method The measured quantity and the known quantity are alternately connected to the input of the device, and the value of the unknown quantity is estimated from the two readings of the device. The highest measurement accuracy is obtained when, as a result of selecting a known value, the device produces the same output signal as with an unknown value.
Example: measuring a small voltage using a highly sensitive galvanometer, to which a source of unknown voltage is first connected and the pointer deflection is determined, and then the same pointer deflection is obtained using an adjustable source of known voltage. In this case, the known voltage is equal to the known one.
At matching method measure the difference between the measured value and the value reproduced by the measure, using the coincidence of scale marks or periodic signals.
Example: measuring the rotation speed of a part using a flashing strobe lamp: observing the position of the mark on the rotating part when the lamp flashes, but the frequency of the flashes and the displacement of the mark determine the rotation speed of the part.
Measurement error. Basic concepts and types of errors
. Basic concepts and types of errors.
The measurement procedure consists of the following main steps:
- accepted models of the measurement object;
- choice of measurement method;
- selection of measuring instruments;
- conducting an experiment to obtain a numerical value of a measurement result.
Various shortcomings inherent in these stages lead to the fact that the measurement result differs from the true value of the measured value.
The reasons for the error may vary.
Measuring transformations are carried out using various physical phenomena, on the basis of which it is possible to establish the relationship between the measured quantity of the object of study and the output signal of the measuring instrument, by which the measurement result is evaluated.
It is never possible to accurately establish this relationship due to insufficient knowledge of the object of study and the inadequacy of its adopted model, the impossibility of accurately taking into account the influence of external factors, insufficient development of the theory of physical phenomena underlying the measurement, the use of simple but approximate analytical dependencies instead of more accurate but complex and etc.
The concept of “error” is one of the central ones in metrology, where the concepts of “error of the measurement result” and “error of the measuring instrument” are used. Measurement result error is the difference between the measurement result X and the true (or actual) value Q of the measured quantity:
It indicates the limits of uncertainty in the value of the measured quantity. Measuring instrument error- the difference between the SI reading and the true (actual) value of the measured PV. It characterizes the accuracy of the measurement results carried out by this tool.
These two concepts are in many ways close to each other and are classified according to the same criteria.
By nature of manifestation errors are divided into random, systematic, progressive and gross (misses).
Note that from the above definition of error it does not in any way follow that it must consist of any components. The division of the error into components was introduced for the convenience of processing measurement results based on the nature of their manifestation. During the formation of metrology, it was discovered that the error is not a constant value. Through elementary analysis, it was established that one part of it appears as a constant value, while the other changes unpredictably. These parts were called systematic and random errors.
As will be shown in Sect. 4.3, the change in error over time is a non-stationary random process. Dividing the error into systematic, progressive and random components is an attempt to describe different parts of the frequency spectrum of this broadband process: infra-low frequency, low frequency and high frequency.
Random error- a component of the measurement error that changes randomly (in sign and value) in a series of repeated measurements of the same EF size, carried out with the same care under the same conditions. There is no pattern observed in the appearance of such errors (Fig. 4.1); they are detected during repeated measurements of the same quantity in the form of some scatter in the results obtained. Random errors are inevitable, irremovable and always present as a result of measurement. Description of random errors is possible only on the basis of the theory of random processes and mathematical statistics.
 |
Unlike systematic, random errors cannot be eliminated from measurement results by introducing a correction, but they can be significantly reduced by increasing the number of observations. Therefore, to obtain a result that differs minimally from the true value of the measured value, multiple measurements of the required value are carried out, followed by mathematical processing of the experimental data.
Of great importance is the study of random error as a function of observation number i or the corresponding time point 1 of the measurements, i.e. D; = A(t.). Individual error values are values of the function A(t), therefore, the measurement error is a random function of time. When carrying out multiple measurements, one realization of such a function is obtained. This is exactly the implementation shown in Fig. 4.1. Repeating a series of measurements will give us another implementation of this function, different from the first, etc. The error corresponding to each i-th measurement is the cross section of the random function A(t). In each section of this function one can find the average value around which the errors in various implementations are grouped. If a smooth curve is drawn through the average values obtained in this way, it will characterize the general trend of changes in the error over time.
Systematic error- component of the measurement error that remains constant or changes naturally with repeated measurements of the same PV. Constant and variable systematic errors are shown in Fig. 4.2. Their distinctive feature is that they can be predicted, detected and, thanks to this, almost completely eliminated by introducing an appropriate correction.
It should be noted that recently the above definition of systematic error has been subject to justified criticism, especially in connection with technical measurements. It is quite reasonably proposed to consider systematic error as a specific, “degenerate” random variable (see Section 5.1), which has some, but not all, properties of a random variable studied in probability theory and mathematical statistics. Its properties, which must be taken into account when combining error components, are reflected by the same characteristics as the properties of “real” random variables: dispersion (standard deviation) and cross-correlation coefficient.
Progressive (drift) error is an unpredictable error that changes slowly over time. This concept was first introduced in the monograph by M.F. Malikov “Fundamentals of Metrology”, published in 1949. Distinctive features of progressive errors:
They can be corrected by amendments only at a given point in time, and then change again unpredictably;
Changes in progressive errors over time are a non-stationary random process, and therefore, within the framework of a well-developed theory of stationary random processes, they can
be described only with certain reservations.
The concept of progressive error is widely used in studying the dynamics of SI errors and the metrological reliability of the latter.
 |
Gross error (miss)- this is a random error in the result of an individual observation included in a series of measurements, which, for given conditions, differs sharply from the other results of this series. They usually arise due to errors or incorrect actions of the operator (his psychophysiological state, incorrect readings, errors in records or calculations, incorrect switching on of devices or malfunctions in their operation, etc.). Short-term sudden changes in measurement conditions can also be a possible cause of errors. If errors are detected during the measurement process, the results containing them are discarded. However, most often errors are identified only during the final processing of measurement results using special criteria, which are discussed in Chapter. 7.
By way of expression , distinguish between absolute, relative and reduced errors.
Absolute error is described by formula (4.1) and is expressed in units of the measured quantity.
However, it cannot fully serve as an indicator of measurement accuracy, since the same value, for example, D = 0.05 mm at X = 100 mm corresponds to a fairly high measurement accuracy, and at X = 1 mm - low. Therefore, the concept of relative error is introduced. Relative error is the ratio of the absolute measurement error to the true value of the measured quantity:
This visual characteristic of the accuracy of the measurement result is not suitable for normalizing the SI error, since when the values change, Q takes on different values up to infinity at Q = 0. In this regard, to indicate and normalize the SI error, another type of error is used - reduced.
Given error - this is a relative error in which the absolute error of the SI is related to the conventionally accepted one, constant over the entire measurement range or part of it:
The conventionally accepted value of Q N is called normalizing. Most often, it is taken to be the upper limit of measurements of a given SI, in relation to which the concept of “reduced error” is mainly used.
Depending on the place of origin distinguish between instrumental, methodological and subjective errors.
Instrumental error due to the error of the used SI. Sometimes this error is called hardware
Methodological error measurements are determined by:
The difference between the accepted model of the measured object and the model that adequately describes its property, which is determined by measurement;
The influence of methods of using SI. This occurs, for example, when measuring voltage with a voltmeter with a finite value of internal resistance. In this case, the voltmeter shunts the section of the circuit on which the voltage is measured, and it turns out to be less than it was before connecting the voltmeter;
The influence of algorithms (formulas) by which measurement results are calculated;
The influence of other factors not related to the properties of the measuring instruments used.
A distinctive feature of methodological errors is that they cannot be indicated in the regulatory and technical documentation for the measuring instrument used, since they do not depend on it, but must be determined by the operator in each specific case. In this regard, the operator must clearly distinguish between the quantity actually measured and the quantity to be measured.
Subjective (personal) error measurements are due to the operator’s error in reading readings on SI scales and diagrams of recording instruments. They are caused by the condition of the operator, his position during work, imperfection of the sensory organs, and the ergonomic properties of the SI. Characteristics of personal error are determined on the basis of the normalized nominal value of the scale division of the measuring instrument (or the chart paper of the recording instrument), taking into account the ability of the “average operator” to interpolate within the scale division.
By dependence of the absolute error on the values of the measured quantity errors are distinguished (Fig. 4.4):
additive, independent of the measured value;
multiplicative, which are directly proportional to the measured value;
nonlinear, having a nonlinear dependence on the measured value.
These errors are used mainly to describe the metrological characteristics of SI. The division of errors into additive, multiplicative and nonlinear is very important when addressing the issue of normalization and mathematical description of SI errors.
Examples of additive errors are from a constant load on a scale, from inaccurate zeroing of the instrument needle before measurement, from thermo-EMF in DC circuits. The causes of multiplicative errors can be: a change in the gain of the amplifier, a change in the rigidity of the pressure gauge sensor membrane or the device spring, a change in the reference voltage in a digital voltmeter.
 |
Rice. (1).4. Additive (a), multiplicative (b) and nonlinear (c) errors
By influence of external conditions distinguish between main and additional SI errors. Basic is called the SI error, determined under normal conditions of its use. For each measuring instrument, the operating conditions are specified in the regulatory and technical documents - a set of influencing quantities (ambient temperature, humidity, pressure, voltage and frequency of the supply network, etc.), under which its error is normalized. Additional, is called the SI error that arises due to the deviation of any of the influencing quantities.
IN depending on the influence of the nature of changes in the measured quantities SI errors are divided into static and dynamic. Static error- this is the error of the SI used to measure PV, taken as constant. Dynamic is called the SI error, which additionally arises when measuring the PV variable and is caused by the discrepancy between its response to the rate (frequency) of change of the measured signal.
14. Concept, types, features of measuring scales
Measurement is an algorithmic operation that assigns a certain designation to a given observed state of an object: a number, a number or a symbol. Let's denote it by xi. i=1,…, m is the observed state (property) of the object, and through уi, i = 1,..,m is the designation for this property. The closer the correspondence between states and their designations, the more information can be extracted as a result of data processing. It is less obvious that the degree of this correspondence depends not only on the organization of measurements (i.e., on the experimenter), but also on the nature of the phenomenon under study, and that the degree of correspondence itself, in turn, determines the acceptable (and unacceptable) methods of data processing!
Measuring scales, depending on the operations allowed on them, differ in their strength. The weakest are nominal scales, and the strongest are absolute.
S. Stevens proposed a classification of 4 types of measurement scales:
1) nominative, or nominal, or scale of names;
2) ordinal, or ordinal, scale;
3) interval, or scale of equal intervals;
4) scale of equal relations.
There are three main attributes of measurement scales, the presence or absence of which determines whether the scale belongs to one category or another:
1. data ordering means that one point on the scale corresponding to the property being measured is greater than, less than or equal to another point;
2. intervallicity of scale points means that the interval between any pair of numbers corresponding to the properties being measured is greater than, less than, or equal to the interval between another pair of numbers;
3. zero point (or reference point) means that the set of numbers corresponding to the properties being measured has a reference point, designated zero, which corresponds to the complete absence of the measured property.
In addition, the following groups are distinguished:
non-metric or qualitative scales in which there are no units of measurement (nominal and ordinal (rank) scales);
quantitative or metric (interval scale, absolute scale).
Scaling is a display of any property of an object or phenomenon in a numerical set.
We can say that the stronger the scale in which measurements are made, the more information about the object, phenomenon, or process being studied, the measurements provide. Therefore, it is natural for every researcher to strive to carry out measurements on the strongest possible scale. However, it is important to keep in mind that the choice of a measurement scale should be guided by the objective relationships to which the observed value is subject, and it is best to make measurements on the scale that is most consistent with these relationships. It is possible to measure on a scale weaker than the agreed upon one (this will lead to the loss of some useful information), but using a stronger scale is dangerous: the data obtained will not actually have the strength that their processing is oriented towards.
Sometimes researchers strengthen the scales; a typical case is the “digitization” of qualitative scales: classes in a nominal or ordinal scale are assigned numbers, which are then “worked with” as numbers. If this processing does not go beyond the limits of permissible transformations, then “digitization” is simply recoding into a more convenient (for example, for a computer) form. However, the use of other operations is associated with misconceptions and errors, since the properties imposed in this way do not actually exist.
Types of scales:
Nominative or naming scale:
Allows you to determine which class a particular measurement object belongs to. All objects are grouped by class. Each class is assigned a meaning. The peculiarity is that one value of numbers is taken into account. Ordinary arithmetic operations are not allowed. We can infer identity from the property being measured. In other words, objects are compared with each other and their equivalence or non-equivalence is determined. As a result of the procedure, a set of equivalence classes is formed. Objects belonging to the same class are equivalent to each other and different from objects belonging to other classes. Equivalent objects are given the same names. We can talk about a naming scale in the case when empirical objects are simply “marked” with a number. Despite the tendency to “overestimate” the power of the scale, psychologists very often use the naming scale in research. “Objective” measurement procedures in diagnosing personality lead to typology: the assignment of a specific personality to one type or another. An example of such a typology is the classical temperaments: choleric, sanguine, melancholic and phlegmatic.
The simplest nominative scale is called dichotomous. When measuring on a dichotomous scale, the characteristics being measured can be coded by two symbols or numbers, for example 0 and 1, or 2 and 6, or the letters A and B, as well as any two symbols that differ from each other. A trait measured on a dichotomous scale is called an alternative trait. In a dichotomous scale, all objects, signs or properties being studied are divided into two non-overlapping classes, and the researcher raises the question of whether the trait of interest “appeared” in the subject or not.
Operations with numbers for the nominative scale.
1) Finding the frequency distribution of scale items using percentages or
number to the general series of distribution (frequency).
2) Finding the average trend by modal frequency. Modal (Mo) is a group with
greatest number. These two operations give an idea of the distribution
psychological characteristics in quantitative terms. Its visibility increases
display in diagrams.
3) The most powerful way of quantitative analysis is to establish relationships
between rows of properties arranged randomly. For this purpose, they compile
cross tables. In addition to simple percentages in cross tables
Ordinal (rank) scale:
Measurements involve assigning numbers to objects depending on the severity of the trait. This scale divides the entire set of characteristics into many, which are connected by the relationships “more - less”. For objects with the same expression of a characteristic, the rule of equal ranks is used. When ranking, it is necessary to indicate which value (the largest or the smallest) is assigned the first rank. This operation must be the same for all features.
To check the correctness of the ranking, the formula is used: the sum of the ranks is equal to the total number of dimensions multiplied by the sum N+1 and divided by 2.
Order scales are widely used in the psychology of cognitive processes, experimental psychosemantics, and social psychology: ranking, evaluation, including pedagogical ones, provide ordinal scales. A classic example of the use of ordinal scales is in testing personality traits as well as abilities. Most experts in the field of intelligence testing believe that the procedure for measuring this property allows the use of an interval scale and even a ratio scale.
The median can be used as a characteristic of central tendency, and percentiles can be used as a characteristic of dispersion. To establish a relationship between two measurements, ordinal correlation (Kandell's t- and Spearman's p-correlation) is acceptable.
A characteristic feature of ordinal scales is that the order ratio says nothing about the distance between the classes being compared. Therefore, ordinal experimental data, even if they are represented by numbers, cannot be considered as numbers. Numerical values on an ordinal scale cannot be added, subtracted, divided or multiplied.
Interval scale.
Reflects the level of expression of the property. This scale assumes the use of units of measurement. Test scales developed as a result of standardization. But in this scale there is no zero reference point. A number of authors believe that there is no reason to classify intelligence tests as interval scales. Firstly, each test has a “zero” - any individual can receive the minimum score if he does not solve a single problem in the allotted time. Secondly, the test has a maximum scale - the score that the test taker can receive by solving all the problems in the minimum time. Third, the difference between individual scale values is not the same. At the very least, there is no theoretical or empirical basis for asserting that 100 and 120 points on an IQ scale differ by as much as 80 and 100 points.
Most likely, the scale of any intelligence test is a combined scale, with a natural minimum and/or maximum, but ordinal. However, these considerations do not prevent testologists from considering the IQ scale as an interval one, converting “raw” values into scale values using the well-known procedure of “normalizing” the scale
The interval scale allows you to use almost all parametric statistics to analyze data obtained with its help. In addition to the median and mode, the arithmetic mean is used to characterize the central tendency, and dispersion is used to assess the spread. You can calculate skewness and kurtosis coefficients and other distribution parameters. To assess the magnitude of the statistical relationship between variables, Pearson's linear correlation coefficient, etc. is used.
Operations with numbers in the interval metric scale are richer. Than in nominal
1) The reference point on the scale is chosen arbitrarily.
2) All methods of descriptive statistics.
3) Possibilities of correlation and regression analysis. Pearson's pairwise correlation coefficient and multiple correlation coefficients can be used, which can predict changes in one variable as a function of changes in another or a range of variables.
The scale is absolute. (relationship scale):
The relationship scale is also called the equal relationship scale. A feature of this scale is the presence of a firmly fixed zero, which means the complete absence of any property or characteristic. The ratio jackal is the most informative scale, allowing any mathematical operations and the use of a variety of statistical methods. The ratio scale is essentially very close to the interval scale, since if you strictly fix the starting point, then any interval scale turns into a ratio scale.
The ratio scale shows data on the expression of the properties of objects, when you can say how many times one object is larger or smaller than another.
This is possible only when, in addition to the definition of equality, rank order, and equality of intervals, the equality of relations is known. The ratio scale differs from the interval scale in that the position of the “natural” zero is determined on it. A classic example is the Kelvin temperature scale. It is on the ratio scale that precise and ultra-precise measurements are made in sciences such as physics, chemistry, microbiology, etc. Measurements on the ratio scale are also made in sciences close to psychology, such as psychophysics, psychophysiology, psychogenetics.
Measuring mass, reaction time and performing a test task are the areas of application of the ratio scale.
In ratio scales, classes are designated by numbers that are proportional to each other: 2 is to 4 as 4 is to 8. This assumes an absolute zero reference point. It is believed that in psychology, examples of scales of equal relations are scales of absolute sensitivity thresholds. The capabilities of the human psyche are so great that it is difficult to imagine absolute zero in any measurable psychological variable. Absolute stupidity and absolute honesty are concepts rather of everyday psychology.
Conversions from one scale to another are possible. The results obtained on the interval scale can be converted into ranks or converted into a nominative scale.
Consider, for example, the primary results of six subjects on the extraversion scale -
introversion test Eysenck. the psychologist must remember that in reality
hides behind the quantities with which it operates.
1) The first limitation is the proportionality of quantitative indicators recorded by different scales within the same study. A stronger scale differs from a weak one in that it allows for a wider range of mathematical operations with numbers. Everything that is acceptable for a weak scale is also acceptable for a stronger one, but not vice versa. Therefore, mixing measurement standards of different types in the analysis leads to the fact that the capabilities of strong scales are not used.
2) The second limitation is related to the shape of the distribution of values fixed by the scales described above, which is assumed to be normal.
The problem of ensuring high product quality is closely related to the problem of measurement quality. There is clearly a direct connection between them: where the quality of measurements does not meet the requirements of the technological process, it is impossible to achieve a high level of product quality. Therefore, product quality largely depends on the successful solution of issues related to the accuracy of measuring the quality parameters of materials and components and maintaining specified technological conditions. In other words, technical quality control carried out by measuring the parameters of technological processes, the measurement results of which are necessary for regulating the process.
Hence, quality of measurements is a set of properties of the measurement state that provide measurement results with the required accuracy characteristics, obtained in the required form over a certain period of time.
Basic properties of the measurement state:
Accuracy of measurement results;
Reproducibility of measurement results;
Convergence of measurement results;
Quick results;
Unity of measurements.
At the same time, under reproducibility of measurement results is understood as the closeness of measurement results of the same quantity, obtained in different places, by different methods, by different means, by different operators, at different times, but under the same measurement conditions (temperature, pressure, humidity, etc.).
Convergence of measurement results- this is the closeness of the results of measurements of the same quantity, carried out repeatedly using the same means, by the same method under the same conditions and with the same care.
Any measurement or quantification of something is carried out using appropriate scales.
Scale- this is an ordered series of marks corresponding to the relationship between successive values of the measured quantities. Measurement scale is an agreed-upon sequence of values of quantities of the same name of different sizes.
In metrology, a measurement scale is a means of adequately comparing and determining the numerical values of individual properties and qualities of various objects. In practice, five types of scales are used: a name scale, an order scale, an interval scale, a ratio scale and an absolute value scale.
Name scale (nominal scale). This is the simplest of all scales. In it, numbers act as labels and serve to detect and distinguish the objects being studied. The numbers that make up the naming scale are allowed to be swapped. There are no more-less relationships in this scale, so some believe that the use of a naming scale should not be considered a measurement. When using a naming scale, only certain mathematical operations can be performed. For example, its numbers cannot be added and subtracted, but you can count how many times (how often) a particular number appears.
Order scale. The places occupied by quantities on the order scale are called ranks, and the scale itself is called rank, or non-metric. In such a scale, its constituent numbers are ordered by rank (i.e., occupied places), but the intervals between them cannot be accurately measured. Unlike the naming scale, the order scale allows not only to establish the fact of equality or inequality of measured objects, but also to determine the nature of inequality in the form of judgments: “more-less”, “better-worse”, etc.
Using order scales, you can measure qualitative indicators that do not have a strict quantitative measure. These scales are used especially widely in the humanities: pedagogy, psychology, sociology. A greater number of mathematical operations can be applied to the ranks of the order scale than to the numbers of the name scale.
Interval scale. This is a scale in which numbers are not only ordered by rank, but also separated by certain intervals. The feature that distinguishes it from the ratio scale described below is that the zero point is chosen arbitrarily. Examples include calendar time (the beginning of chronology in different calendars was set for random reasons, temperature, potential energy of a lifted load, electric field potential, etc.).
The results of measurements on an interval scale can be processed by all mathematical methods, except for calculating ratios. Interval scale data provides an answer to the question “how much more?”, but does not allow us to state that one value of a measured value is so many times greater or less than another. For example, if the temperature increased from 10 to 20°C, then it cannot be said that it has become twice as warm.
Relationship scale. This scale differs from the interval scale only in that it strictly defines the position of the zero point. Thanks to this, the ratio scale does not impose any restrictions on the mathematical apparatus used to process observational results.
The ratio scale also measures those quantities that are formed as differences between numbers measured on the interval scale. Thus, calendar time is counted on a scale of intervals, and time intervals - on a scale of ratios.
When using a ratio scale (and only in this case!), the measurement of any quantity is reduced to the experimental determination of the ratio of this quantity to another similar one, taken as a unit. By measuring the length of an object, we find out how many times this length is greater than the length of another body taken as a unit of length (a meter ruler in this case), etc. If we limit ourselves only to the use of ratio scales, then we can give another (narrower, more specific) definition of measurement: to measure a quantity means to experimentally find its relation to the corresponding unit of measurement.
Absolute value scale. In many cases, the magnitude of something is directly measured. For example, the number of defects in a product, the number of units produced, how many students are present at a lecture, the number of years lived, etc. are directly calculated. and so on. For such measurements, the measuring scale is marked
absolute quantitative values of what is being measured. Such a scale of absolute values has the same properties as a scale of ratios, with the only difference being that the values indicated on this scale have absolute rather than relative values.
Measurement results on a scale of absolute values have the greatest reliability, information content and sensitivity to measurement inaccuracies.
Scales of intervals, ratios and absolute values are called metric, since in their construction some measures are used, i.e. dimensions accepted as units of measurement.
In practical activities, there is a need to measure various quantities that characterize the properties of bodies, substances, phenomena, processes and systems. However, some properties are manifested only qualitatively, others – qualitatively and quantitatively. Various manifestations of any property form sets, the mapping of whose elements onto an ordered set of numbers or, in a more general case, conventional signs, form measurement scales these properties. A scale for measuring a quantity is an ordered sequence of values for that quantity, adopted by agreement based on the results of precise measurements. The terms and definitions of the theory of measurement scales are set out in “RMG 83-2007 Recommendations for interstate standardization. State system for ensuring the uniformity of measurements. Measurement scales. Terms and Definitions".
In accordance with the logical structure of the manifestation of properties, there are five main types of measurement scales: names, order, differences (intervals), ratios and absolute.
Scale of names or classifications or scale of measurement of a qualitative property. Such scales are used to classify objects whose properties are manifested only in relation to the equivalence or differences in the manifestations of this property. This is the simplest type of scale and is classified as qualitative. They lack the concept of zero, “more or less” and units of measurement. For a scale of names or classifications, changes to the specifications describing a specific scale are not permitted. The measurement process is carried out using human senses - eyes, nose, ears. Here the most adequate result, chosen by the majority of experts. In this case, the correct choice of classes of the equivalent scale is of great importance - they must be reliably distinguished by observers - experts assessing this property.
On a naming scale, numbers can be assigned to objects, but they can only be used to determine the probability or frequency of occurrence of a given object, and not for summation or other mathematical operations. For example, players in a team can be numbered in order to study the qualitative playing capabilities of each player.
The colors differ, first of all, in quality. Therefore, color measurement scales (colorimetry) are naming scales, but ordered based on the proximity (similarity) of colors. In addition, qualitatively indistinguishable colors (of the same chromaticity) can differ quantitatively in lightness (brightness).
Since biblical times, there have been scales of colors based on their designation by systems of names or other symbols. Most often, the starting points for the formation of such naming scales are the seven colors of the rainbow. Combinations of these and other names make up hundreds and even thousands of flower names. In such scales, the color space is divided into a number of blocks, which are designated in accordance with generally accepted color terminology or symbol combinations (code). For example, in the Eurocolor system, the color code is a seven-digit number: the first three digits correspond to color tone, the fourth and fifth - lightness, the sixth and seventh - color saturation. In the Munsell system, the color code is made up of alphabetic characters and numbers. However, there is not yet a globally accepted system of names and symbolic designations for colors.
Such symbolic scales of color names are materialized in the form of color atlases, consisting of the required number of standardized color samples. In the USSR, an “Atlas of Standard Color Samples” was created, containing 1000 color samples. It is intended for metrological support in various industries. The color of the industrial design is visually compared with the color of the reference sample placed in the atlas. The color atlas, specialized for printing, contains 1358 material color samples. In addition, there are many special color scales of lower levels of general validity. For example,
GOST 2667-82 Color scale for light petroleum products.
GOST 3351-74 Drinking water color scale
GOST 12789-87 Iodine and cobalt-chromium beer color scales
GOST 19266-79 Iodometric color scale for paints and varnishes
Color measurements are widely used in the manufacture of picture tubes for color televisions, in light and color signaling, in transport, in traffic control, in navigation, in printing, in the construction and textile industries. There are a significant number of national and international standards for the corresponding color measurement methods.
In the chemical and food industries, colorimetry is used to determine the color of aromatic hydrocarbons of the benzene series according to GOST 2706.1-74, the color of sulfuric acid according to GOST 2706.3-74, the color of vegetable oils according to GOST 5477-93, the color of inorganic pigments and fillers according to GOST 16873-92, color sugar - sand and refined sugar according to GOST 12572-93. (To consolidate the material, it is recommended to familiarize yourself with the contents of any of the above-mentioned standards, which describe specific scales of names or classifications).
Comparing properties on a naming scale can only be done by an experienced expert who has not only practical experience, but also the appropriate visual or olfactory capabilities. To obtain comparable results for assessing physical quantities related to the scale of names, in recent years, international and national standards have been developed and adopted by the world community, such as
GOST R 53161-2008 (ISO 5495:2005). National standard of the Russian Federation. Organoleptic analysis. Methodology. Paired comparison method;
GOST R ISO 8586-1-2008. National standard of the Russian Federation. Organoleptic analysis. General guidelines for the selection, training and supervision of testers. Part 1: Selected Testers;
GOST R ISO 8588-2008 National standard of the Russian Federation. Organoleptic analysis. Methodology. Tests "A" - "not A".
Scale of orders or ranks – This is a scale of measurement of a quantitative property (quantity), characterized by equivalence relations and ascending or descending order of various manifestations of the property. It is monotonically increasing or decreasing and allows you to establish a greater/lesser ratio between quantities characterizing the specified property. In scales of order, zero exists or does not exist. However, it is fundamentally impossible to enter a unit of measurement and dimension. Consequently, it is impossible to judge how many times more or less specific manifestations of a property are. In practice, conditional order scales are used. Any monotonic transformations are allowed in them, but changing the specifications describing specific scales is unacceptable. In scales of orders or rank-based values of physical quantities are expressed in conventional units - ranked.
Determining the meaning of quantities using order scales often cannot be considered a measurement. For example, in pedagogy, sports and other activities the term “assessment” is used. Knowledge at school or university is assessed on a 5 or 4 point scale. The results of contests and competitions are assessed in the same way. Organoleptic methods are used to evaluate product quality in accordance with established rules.
Order scales with reference points for physical bodies and phenomena marked on them have become widespread. Points on the reference scale can be assigned numbers called points. Such scales include the 10-point Mohs scale for assessing the hardness numbers of minerals, the Rockwell, Brinell, Vickers scales for determining the hardness of metals, the 12-point Beaufort scale for assessing the strength of sea wind, the 12-point Richter earthquake scale (seismic international scale) ), Engler viscosity scale, film sensitivity scale, whiteness scale, acoustic sound volume scale and others.
The whiteness scales are unique. The whiteness of the scattering surfaces of materials characterizes their similarity in color to some standard white color, the whiteness of which is taken as 100%. A unified whiteness scale for different types of materials has not yet been created, but in all versions of the whiteness scales used, the deviation of the color under study from standard white is determined by one-dimensional criteria, for example, color difference. Whiteness scales are one-dimensional order scales. The whiteness of paper, cardboard, cellulose, textile materials is assessed by the reflectance in the blue region of the spectrum at a wavelength of 457 nm.
Examples of specific methods for determining whiteness (whiteness scale):
GOST 7690-76 Pulp, paper, cardboard. Methods for determining whiteness.
GOST 26361-84 Flour. Method for determining whiteness.
GOST 24024-80 Phosphorus and inorganic phosphorus compounds. Method for determining the degree of whiteness.
GOST 16873-92 Inorganic pigments and fillers. Method color and whiteness measurements.*
Metrological support for whiteness measurements is based on state standards GET 81-90 (color coordinates and chromaticity coordinates) and GET 156-91 (spectral reflectance).
In practice, the photosensitivity of photographic materials is assessed using an order scale, which is characterized by photosensitivity numbers. For example, in Russia these are sensitivity numbers according to GOST, in Germany according to DIN, there is an international scale of general photosensitivity numbers recommended by ISO.
Scales of names and order are called conventional scales, since they do not define units of measurement. They are also called non-metric or conceptual. In conventional scales, identical intervals between the dimensions of a given quantity, for example, hardness numbers, do not correspond to identical dimensions of the properties of quantities. Therefore, points cannot be added, subtracted, or divided. There can be as many different types of conventional scales as desired, since they appear as it becomes necessary to evaluate (determine) any value in the form of an assigned number.
Interval or difference scale. This scale describes the quantitative properties of quantities, manifested in the relations of equivalence, order and additivity (summing the intervals of various manifestations of the property). The interval scale consists of identical intervals, the scale of which is established by agreement, has a unit of measurement and an arbitrarily chosen zero point. On the interval scale, the actions of adding and subtracting intervals are possible; it is possible to estimate how many times one interval is larger than another, the concept of “dimension” is applicable, changes in specifications describing specific scales are acceptable. However, for some physical quantities it makes no sense to add the physical quantities themselves, for example, calendar dates.
Examples of interval scales - chronology according to various calendars, time scale, temperature scales of Celsius, Fahrenheit, length scale.
There are two reference points on the Celsius scale: the melting temperature of ice and the boiling point of water. Scale scale – 1 degrees Celsius– is selected as one hundredth of the interval between two reference points. The Fahrenheit scale also has two reference points: the temperature of a mixture of ice, table salt and ammonia and the temperature of the human body. Scale scale – 1 degrees Fahrenheit– is selected as one ninety-sixth of the interval between two reference points.
Relationship scale. This scale also describes the quantitative properties of quantities, manifested in the relations of equivalence, order and proportionality (scales of the first kind), or the additivity of various manifestations of the property (scales of the second kind). In proportional scales of relations (of the 1st kind), the summation operation does not make sense.
For example, the thermodynamic temperature scale is a scale of the first kind, the mass scale is of the second kind. Distinctive features of ratio scales: the presence of a natural zero and a unit of measurement established by agreement; applicability of the concept of "dimension". All arithmetic operations are applicable to the values obtained on this scale, that is, scale transformations are permissible, and changes in specifications describing specific scales are permissible. From a formal point of view, the ratio scale is an interval scale with a natural origin. The relationship scales are the most advanced. They are described by the equation:
Where X– physical quantity for which the scale is constructed, q- numerical value of a physical quantity, – unit of measurement of a physical quantity. For example, P = 10 N, m = 50 kg
The transition from one scale of relations to another occurs in accordance with the equation q 2 = q 1  /
/ , since the size of the property is a constant value.
Absolute scale is a ratio scale (proportional or additive) of a dimensionless quantity. Such scales have all the features of ratio scales, but additionally have a natural, unambiguous definition of the unit of measurement, independent of the adopted system of units of measurement. In these scales, only identical transformations are allowed and changes to the specifications describing specific scales are allowed. Examples of scales of relative values: efficiency, gain or attenuation factors, amplitude modulation factors, nonlinear distortion factors, etc. A number of absolute scales have boundaries between zero and one. Measurement results in absolute scales can be expressed not only in arithmetic units, but also in percentages, ppm, bits, bytes, decibels (see logarithmic scales). Absolute scale units can be used in combination with dimensional units. For example: information transmission rate in bits per second. Absolute scales are widely used in radio engineering and electrical measurements. A type of absolute scales are discrete (countable) scales, in which the result of a measurement is expressed by the number of particles, quanta or other objects that are equivalent in the manifestation of the property being measured. For example, scales for the electric charge of atomic nuclei, the number of quanta (in photochemistry), and the amount of information. Sometimes a certain number of particles (quanta) is taken as a unit of measurement (with a special name) in such scales, for example, one mole is the number of particles equal to Avogadro’s number.
Scales of intervals and ratios are called metric (material). Absolute and metric scales belong to the category of linear.
The importance of studying the characteristics of various scales and the features of their use, along with legalized units of measurement, has increased significantly in recent years in the system of ensuring the uniformity of measurements. This process will develop towards the inclusion of the concept of “measurement scale” in the definition of unity of measurement. The practical implementation of measurement scales is carried out by standardizing the scales themselves, units of measurement, methods and conditions for their unambiguous reproduction.
 Download work on the topic: Research work of students and ways to improve it
 What is the inconsistency of the social process?
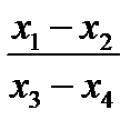 Measuring scales Absolute measurement scale