Laboratory work in physics. Laboratory work in physics Determining the moment of inertia of a physical pendulum depending on the mass distribution
Laboratory work number 1.
Study of uniformly accelerated motion without initial speed
Objective: to establish a qualitative dependence of the body's velocity on time during its uniformly accelerated movement from a state of rest, to determine the acceleration of the body's movement.
Equipment: laboratory trough, carriage, tripod with clutch, stopwatch with sensors.
.
I have read the rules and agree to abide by them. ________________________
Student's signature
Note: During the experiment, the carriage is launched several times from the same position on the chute and its speed is determined at several points at different distances from the initial position.
If a body moves uniformly accelerated from rest, then its displacement changes with time according to the law:S = at 2 /2 (1), and the speed isV = at(2). If we express acceleration from formula 1 and substitute it in 2, then we get a formula expressing the dependence of speed on displacement and time of movement:V = 2 S/ t.
1. Uniformly accelerated motion is ___
2. In what units in the C system is it measured:
acceleration a =
speed =
time t =
moving s =
3. Write the acceleration formula in projections:
a x = _________________.
4. Find the acceleration of the body from the velocity graph.
a =
5. Write the displacement equation for uniformly accelerated motion.
S= + ______________
If a 0 = 0, then S=
6. The movement is uniformly accelerated if the pattern is fulfilled:
S 1 :S 2 :S 3 : … : S n = 1: 4: 9: ... : n 2 .
Find an attitudeS 1 : S 2 : S 3 =
Working process
1. Prepare a table to record the results of measurements and calculations:
2. Attach the chute to the tripod at an angle using a coupler so that the carriage slides down the chute on its own. Using a magnetic holder, fix one of the stopwatch sensors on the chute at a distance of 7 cm from the beginning of the measuring scale (x 1 ). Fasten the second sensor opposite the value of 34 cm on the ruler (x 2 ). Calculate displacement (S), which the carriage will make when moving from the first sensor to the secondS=x 2 – x 1 = ____________________
3. Place the carriage at the beginning of the chute and release it. Take a stopwatch (t).
4. Calculate the formula for the carriage speed (V), with which it moved past the second sensor and the acceleration of movement (a):


=
______________________________________________________
5. Move the lower sensor down 3 cm and repeat the experiment (experiment no. 2):
S = ________________________________________________________________
V = _____________________________________________________________
a = ______________________________________________________________
6. Repeat the experiment, removing the lower sensor by another 3 cm (experiment No. 3):
S=
a = _______________________________________________________________
7. Make a conclusion about how the speed of the cart changes with the increase in the time of its movement, and about what the acceleration of the carriage turned out to be during these experiments.
___________

Laboratory work number 2.
Measurement of gravitational acceleration
Objective: determine the acceleration of free fall, demonstrate that in free fall, acceleration does not depend on the mass of the body.
Equipment: optoelectric sensors - 2 pcs., steel plate - 2 pcs., measuring blockL-micro, starter platform, power supply.
Safety regulations. Read the rules carefully and sign that you agree to follow them..
Carefully! There should be no foreign objects on the table. Careless handling of devices leads to their fall. At the same time, you can get a mechanical injury-bruise, take the devices out of working condition.
I have read the rules and agree to abide by them. _____________________________
Student's signature
Note: To perform the experiment, a demonstration kit "Mechanics" from a series of equipment is used.L-micro.
In this paper, the free fall accelerationg determined based on time measurementt , spent by the body on a fall from a heighth no initial speed. When conducting an experiment, it is convenient to record the motion parameters of metal squares of the same size, but different thicknesses and, accordingly, different masses.
Training tasks and questions.
1. In the absence of air resistance, the speed of a freely falling body in the third second of falling increases by:
1) 10 m/s 2) 15 m/s 3) 30 m/s 4) 45 m/s
2. Oh . Which of the bodies at the timet 1 acceleration is zero?

3. The ball is thrown at an angle to the horizon (see picture). If the air resistance is negligible, then the acceleration of the ball at the pointBUT co-directed to the vector

1) 1 2) 2 3) 3 4) 4
4. The figures show graphs of the dependence of the projection of velocity on time for four bodies moving along the axisOh . Which of the bodies moves with the greatest acceleration modulo?

According to the graph of the dependence of the projections of the displacement vectors of bodies on the time of their movement (see Fig.), find the distance between the bodies 3 s after the start of movement.

1) 3 m 2) 1 m 3) 2 m 4) 4 m
Working process
1 .
Install the starter platform at the top of the chalkboard. Position two optoelectric sensors vertically below it, orienting them as shown in the figure. The sensors are located at a distance of approximately 0.5 m from each other in such a way that the body falling freely after being released from the launcher passes through their target in sequence.
.
Install the starter platform at the top of the chalkboard. Position two optoelectric sensors vertically below it, orienting them as shown in the figure. The sensors are located at a distance of approximately 0.5 m from each other in such a way that the body falling freely after being released from the launcher passes through their target in sequence.
2. Connect the optoelectric sensors to the connectors on the trigger platform, and the power supply to the connectors of the connecting cable connected to connector 3 of the measuring unit.
3. Select the item "Determining the acceleration of gravity (option 1)" in the menu on the computer screen and enter the equipment settings mode. Pay attention to the images of the sensors in the window on the screen. If only the sensor is present, then the sensor is open. When the optical axis of the sensor is blocked, it is replaced by the image of the sensor with a trolley in its alignment.
4. Hang one of the steel plates from the trigger magnet. In order to process the results using a simple formulah = gt 2 /2 , it is necessary to accurately set the relative position of the steel plate (in the starting device) and the optoelectric sensor closest to it. The timing starts when one of the optoelectric sensors is triggered.
5. Move the upper optoelectric sensor up towards the starting device with the body suspended from it until the image of the sensor with the trolley in its alignment appears on the screen. After that, very carefully lower the sensor down and stop it at the moment when the trolley disappears from the sensor image .
Go to the measurement screen and run a series of 3 runs. Record the time that appears on the computer screen each time.
measure distanceh between optoelectric sensors. Calculate the average value of the fall time of the bodyt Wed and, substituting the obtained data into the formulag = 2 h / t 2 Wed , determine the free fall accelerationg . Do the same with the other square.
Record the data obtained in the table.
experience number
Distance between sensors
h , m
Time
t , with
Time Average
t cf, s
Acceleration of gravity
g , m/s 2
Big plate
Smaller plate
Based on the experiments carried out, draw the following conclusions:
__________________________
Laboratory work number 3.
Study of the dependence of the oscillation period of the spring
pendulum on the mass of the load and the stiffness of the spring
Objective: experimentally establish the dependence of the period of oscillation and the frequency of oscillation of a spring pendulum on the stiffness of the spring and the mass of the load.
Equipment: a set of weights, a dynamometer, a set of springs, a tripod, a stopwatch, a ruler.
Safety regulations. Read the rules carefully and sign that you agree to follow them..
Carefully! There should be no foreign objects on the table. Careless handling of devices leads to their fall. At the same time, you can get a mechanical injury-bruise, take the devices out of working condition.
I am familiar with the rules, I undertake to comply. ___________________________
Student's signature
Training tasks and questions
1. A sign of oscillatory movement - ___________________
__________________________
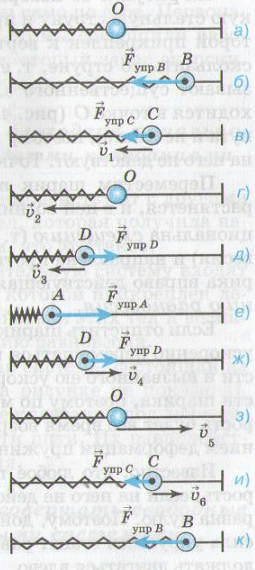
2. In which figure is the body in equilibrium?
_______ ________ _________
3. The elastic force is greatest at the point _________ and __________ shown in the figures _______ ________ ________.
4. At each point on the trajectory of motion, except for the point ______, the ball is affected by the elastic force of the spring, directed towards the equilibrium position.
5. Indicate the points where the speed is greatest ____________ and least _______ _______, acceleration is greatest ______ ______ and least _______.
X  od work
1. Assemble the measuring setup according to the drawing.
2. By stretching the spring x and the mass of the load, determine the stiffness of the spring.
F extr = k x – Hooke's law
F extr = R = mg ;
1) ____________________________________________________
2) ____________________________________________________
3) ____________________________________________________
3. Fill in Table No. 1 of the dependence of the oscillation period on the mass of the load for the same spring.
4. Fill in Table No. 2 of the dependence of the oscillation frequency of the spring pendulum on the stiffness of the spring for a load of 200 g.
5. Draw conclusions about the dependence of the period and frequency of oscillation of a spring pendulum on the mass and stiffness of the spring.


__________________________________________________________________________________________________
Lab #4
Investigation of the dependence of the period and frequency of free oscillations of a filament pendulum on the length of the filament
Objective: find out how the period and frequency of free oscillations of a thread pendulum depend on its length.
Equipment: a tripod with a clutch and foot, a ball with a thread attached to it about 130 cm long, a stopwatch.
Safety regulations. Read the rules carefully and sign that you agree to follow them..
Carefully! There should be no foreign objects on the table. Devices must only be used for their intended purpose. Careless handling of devices leads to their fall. At the same time, you can get a mechanical injury-bruise, take the devices out of working condition.
I have read the rules and agree to abide by them. _______________________
Student's signature
Training tasks and questions
1. What vibrations are called free? ___________________________
________________________________________________________________
2. What is a thread pendulum? ___________________________
________________________________________________________________
3. The period of oscillation is ___________________________________________
________________________________________________________________
4. The oscillation frequency is ___________________________________________
5. Period and frequency are _____________________ values, since their products are equal to ___________________.
6. In what units in the C system is it measured:
period [ T] =
frequency [ν] =
7. A filament pendulum made 36 complete oscillations in 1.2 minutes. Find the period and frequency of the pendulum.
Given: C Solution:
t= 1.2 min = T =
N = 36
T - ?, ν - ?
Working process
1. Place a tripod on the edge of the table.
2. Attach the pendulum string to the tripod leg using a piece of eraser or construction paper.
3. For the first experiment, select a thread length of 5–8 cm and deflect the ball from the equilibrium position by a small amplitude (1–2 cm) and release.
4. Measure the span of time t, for which the pendulum will make 25 - 30 complete oscillations ( N ).
5. Record the measurement results in a table
6. Carry out 4 more experiments in the same way as the first, while the length of the pendulum L increase to the limit.(For example: 2) 20 - 25 cm, 3) 45 - 50 cm, 4) 80 - 85 cm, 5) 125 - 130 cm). 
7. For each experiment, calculate the period of oscillation and write it down in the table.
T 1 = T 4 =
T 2 = T 5 =
T
3 =
8 .
For each experiment, calculate the value of the oscillation frequency or
.
For each experiment, calculate the value of the oscillation frequency or
and write it down in a table.
9. Analyze the results recorded in the table and answer the questions.
a) Did you increase or decrease the length of the pendulum if the oscillation period decreased from 0.3 s to 0.1 s?
________________________________________________________________________________________________________________________________
b) Increased or reduced the length of the pendulum if the oscillation frequency decreased from 5 Hz to 3 Hz
____________________________________________________________________________________________________________________________________
Laboratory work number 5.
Studying the phenomenon of electromagnetic induction
Objective: study the phenomenon of electromagnetic induction.
Equipment: milliammeter, coil coil, arcuate or strip magnet, power source, iron core coil from a collapsible electromagnet, rheostat, key, connecting wires.
Safety regulations. Read the rules carefully and sign that you agree to follow them..
Carefully! Protect appliances from falling. Avoid extreme loads of measuring instruments. When conducting experiments with magnetic fields, you should take off your watch and put away your mobile phone.
________________________
Student's signature
Training tasks and questions
1. Magnetic field induction is ______________________________________
characteristic of the magnetic field.
2. Write down the formula modulus of the magnetic induction vector.
B = __________________.
The unit of measurement of magnetic induction in the C system: AT =
3. What is magnetic flux? ___________________________________________
_________________________________________________________________
4. What does magnetic flux depend on? ___________________________
_________________________________________________________________
5. What is the phenomenon of electromagnetic induction? _________________
_________________________________________________________________
6. Who discovered the phenomenon of electromagnetic induction and why is this discovery classified as the greatest? ______________________________________
__________________________________________________________________
Working process
1. Connect the coil-coil to the clamps of the milliammeter.
2. Insert one of the poles of the magnet into the coil, and then stop the magnet for a few seconds. Write down whether an induction current occurred in the coil: a) during the movement of the magnet relative to the coil; b) while it is stopped.
__________________________________________________________________________________________________________________________________
3. Record if the magnetic flux has changedF penetrating the coil: a) during the movement of the magnet; b) while it is stopped.
4. State the condition under which an induction current appeared in the coil.
5 . Insert one of the poles of the magnet into the coil, and then remove it at the same speed. (Select the speed so that the arrow deviates to half the limit value of the scale.)
________________________________________________________________
__________________________________________________________________
6. Repeat the experiment, but at a higher speed of the magnet.
a) Write down the direction of the induced current. ______________
_______________________________________________________________
b) Write down what the module of the induction current will be. __________________
_________________________________________________________________
7. Write down how the speed of the movement of the magnet affects:
a) By the magnitude of the change in the magnetic flux __________________________
__________________________________________________________________
b) On the induction current module. ___________________________
__________________________________________________________________
8. Formulate how the modulus of the strength of the induction current depends on the rate of change of the magnetic flux.
_________________________________________________________________
9. Assemble the setup for the experiment according to the drawing.

1 - coil-coil
2 - coil
10. Check if there is a spool1 induction current at: a) closing and opening of the circuit in which the coil is included2 ; b) flow through2 direct current; c) changing the current strength with a rheostat.
________________________________________________________________________________________________________________________________
11. Write down in which of the following cases: a) the magnetic flux penetrating the coil changed1 ; b) there was an induction current in the coil1 .
Conclusion:
________________________________________________________________________________________________________________________________________
Lab #6
Observation of continuous and line spectra
emissions
Objective: observation of a continuous spectrum using glass plates with beveled edges and a line emission spectrum using a two-tube spectroscope.
Equipment: projector, double-tube spectroscope, spectral tubes with hydrogen, neon or helium, high-voltage inductor, power supply (these devices are common to the whole class), a glass plate with bevelled edges (given to each).
Description of the device.
Carefully! Electricity! Make sure that the insulation of the conductors is not broken. Avoid extreme loads of measuring instruments.
I have read the rules and agree to abide by them. ______________________
Student's signature
Training tasks and questions
1. The spectroscope was designed in 1815 by a German physicist
________________________________________________________
2. Visible light is electromagnetic waves with frequency:
from _________________Hz to __________________Hz.
3. Which bodies emit a continuous spectrum?
1. ______________________________________________________________
2. ______________________________________________________________
3. ______________________________________________________________
4. What is the spectrum of luminous gases of low density?
________________________________________________________________
5. Formulate G. Kirchhoff's law: _________________________________
_______________________________________________________________
Working process
1. Position the plate horizontally in front of the eye. Through the edges making an angle of 45º, observe a light vertical strip on the screen - an image of the sliding slit of the projection apparatus.
2. Select the primary colors of the resulting continuous spectrum and write them down in the observed sequence.
________________________________________________________________
3. Repeat the experiment, considering the strip through the faces forming an angle of 60º. Record the differences as spectra.
________________________________________________________________
4. Observe the line spectra of hydrogen, helium or neon by examining luminous spectral tubes with a spectroscope.
Write down which lines you can see.
__________________________________________________________________
Conclusion: ____________________________________________________________
__________________________________________________________________
Lab #7
The study of nuclear fission of the uranium atom
track photos
Objective: to verify the validity of the law of conservation of momentum on the example of fission of the uranium nucleus.
Equipment: photograph of tracks of charged particles formed in a photographic emulsion during the fission of the uranium atom nucleus under the action of a neutron, measuring ruler.
Note: the figure shows a photograph of the fission of the uranium atom nucleus under the action of a neuron into two fragments (the nucleus was at the pointg ). It can be seen from the tracks that fragments of the nucleus of the uranium atom scattered in opposite directions (the break in the left track is explained by the collision of the fragment with the nucleus of one of the atoms of the photographic emulsion). The longer the track, the greater the energy of the particle. The track thickness is the greater, the larger the charge of the particle and the lower its speed.
Training tasks and questions
1. Formulate the law of conservation of momentum. ___________________________
__________________________________________________________________

2. Explain the physical meaning of the equation:
__________________________________________________________________
3. Why does the fission reaction of uranium nuclei go with the release of energy into the environment? _______________________________________________
_______________________________________________________________
4. Using an example of any reaction, explain what the laws of conservation of charge and mass number are. _________________________________
_________________________________________________________________
5. Find the unknown element of the periodic table, formed as a result of the following β-decay reaction:

__________________________________________________________________
6. What is the principle of photo emulsion?
______________________________________________________________
Working process
1. Look at the photo and find the tracks of the fragments.

2. Measure the lengths of the fragment tracks with a millimeter ruler and compare them.
3. Using the law of conservation of momentum, explain why the fragments formed during the fission of the uranium atom nucleus scattered in opposite directions. ___________________________________________
_________________________________________________________________
4. Are the charges and energies of the fragments the same? _____________________________
__________________________________________________________________
5. On what grounds can you judge this? ________________________
__________________________________________________________________
6. One of the possible fission reactions of uranium can be written in symbolic form as follows:
where z x – the nucleus of an atom of one of the chemical elements.
Using the law of conservation of charge and the table of D.I. Mendeleev, determine what kind of element it is.
____________________________________________________________________________________________________________________________________
Conclusion: ______________________________________________________________
____________________________________________________________________________________________
Lab #8
The study of tracks of charged particles on ready-made
photographs
Objective: explain the nature of the movement of charged particles.
Equipment: photographs of charged particle tracks obtained in a cloud chamber, a bubble chamber and photographic emulsion.
Training tasks and questions
1. What methods of studying charged particles do you know? _____________
________________________________________________________________________________________________________________________________________________________________________________________________
2. What is the principle of cloud chamber operation? ___________________
________________________________________________________________________________________________________________________________
3. What is the advantage of a bubble chamber over a cloud chamber? How are these devices different? ___________________________________________
________________________________________________________________________________________________________________________________________________________________________________________________
4. What are the similarities between the photoemulsion method and photography?
________________________________________________________________________________________________________________________________________________________________________________________________
5. Formulate the left hand rule for determining the direction of the force acting on a charge in a magnetic field. ____________________________
________________________________________________________________________________________________________________________________________________________________________________________________
6 .
The figure shows the track of a particle in a cloud chamber placed in a magnetic field. The vector is directed away from the plane. Determine the sign of the charge of the particle.
.
The figure shows the track of a particle in a cloud chamber placed in a magnetic field. The vector is directed away from the plane. Determine the sign of the charge of the particle.

______________________________________________________________________________________________________________________________________________________________________________________________________________________________________
Working process

1
 .
Which photographs presented to you (Fig. 1, 2, 3) show tracks of particles moving in a magnetic field? Justify the answer.
.
Which photographs presented to you (Fig. 1, 2, 3) show tracks of particles moving in a magnetic field? Justify the answer.
______________________________________________________________________________________________________
Rice. one
__________________________________
2. Consider a photograph of tracks of α-particles moving in a cloud chamber (Fig. 1).
a) In what direction did the alpha particles move?
__________________________________________________________________________________________________________________________________________________________________________
b) Why are the tracks of α-particles approximately the same length?
______________________________________________________________________________________________________
Rice. 3
__________________________________
__________________________________
c) Why does the thickness of the tracks of α-particles slightly increase towards the end of the motion? ___________________________________________________________
________________________________________________________________________________________________________________________________
3. Figure 2 shows a photograph of α-particle tracks in a cloud chamber in a magnetic field. Answer the following questions.
a) In which direction are the particles moving? _____________________________
________________________________________________________________________________________________________________________________
b) How was the vector of magnetic induction directed? ___________________
________________________________________________________________________________________________________________________________
c) Why did the curvature radius and track thickness change as the α-particles moved? ___________________________________________________________
________________________________________________________________________________________________________________________________
4. Figure 3 shows a photograph of an electron track in a bubble chamber placed in a magnetic field. Answer the following questions.
a) Why is the electron track shaped like a spiral? _____________________
________________________________________________________________________________________________________________________________
b) In what direction did the electron move? __________________________
________________________________________________________________________________________________________________________________
c) How was the vector of magnetic induction directed? ___________________
________________________________________________________________________________________________________________________________
d) What could be the reason that the electron track in Figure 3 is much longer than the tracks of α-particles in Figure 2? _______________________
________________________________________________________________________________________________________________________________
Conclusion: _________________________________________________________
______________________________________________________________________________________________________________________________________________________________________________________________________
Lab #9
Measurement of natural background radiation
dosimeter
Objective: obtaining practical skills in using a household dosimeter to measure background radiation.
Equipment: household dosimeter, instructions for its use.
Safety regulations. Carefully read the rules for using the dosimeter and sign that you undertake to comply with them.. Carefully! Protect the device from falling.
I have read the rules and agree to abide by them. _______________________(_student's signature)
Note: Household dosimeters are intended for operational individual monitoring of the radiation situation by the population and allow an approximate estimate of the equivalent radiation dose rate. Most modern dosimeters measure the radiation dose rate in microsieverts per hour (µSv/h), but another unit is still widely used - microroentgen per hour (µR/h). The ratio between them is: 1 µSv/h = 100 µR/h. The average value of the equivalent dose of absorbed radiation due to natural background radiation is about 2 mSv per year.
Training tasks and questions
1. The absorbed dose of radiation is __________________________________
________________________________________________________________________________________________________________________________________________________________________________________________
2. Absorbed dose formula:
G ![]() de: ________________________________
de: ________________________________
___________________________________
___________________________________
3. Absorbed dose units: =
4. The equivalent dose H is determined by the formula:
![]()
where: ________________________________
___________________________________
5. The unit of equivalent dose is ____________________
6. How many times will the initial number of radioactive nuclei decrease in a time equal to the half-life? ______________________________________
Working process
1. Carefully study the instructions for working with the dosimeter and determine:
what is the procedure for preparing him for work;
what types of ionizing radiation it measures;
in what units the device registers the radiation dose rate;
what is the duration of the measurement cycle;
what are the limits of the absolute measurement error;
what is the procedure for monitoring and replacing the internal power supply;
what is the location and purpose of the controls for the operation of the device.
2. Make an external inspection of the device and its trial inclusion.
3. Make sure the dosimeter is in working order.
4. Prepare the instrument for measuring the radiation dose rate.
5. Measure the background radiation level 8-10 times, recording each time the dosimeter reading.
6. Calculate the average value of the radiation background.
________________________________________________________________________________________________________________________________
7. Calculate what dose of ionizing radiation a person will receive during the year if the average value of the radiation background does not change throughout the year. Compare it with a value that is safe for human health.
________________________________________________________________________________________________________________________________
8. Compare the obtained average background value with the natural radiation background taken as the norm - 0.15 μSv / h ..
Make a conclusion _________________________________________________
_______________________________________________________________
________________________________________________________________
Physics is the science of nature. As a school subject, it occupies a special place, because along with cognitive information about the world around us, it develops logical thinking, forms a materialistic worldview, creates a holistic picture of the universe, and has an educational function.
The role of grade 7 physics in the formation of a person, regardless of the profession chosen by a person, is huge and continues to grow. In many countries, physics as a discipline began to be introduced into the programs of liberal arts universities. Deep knowledge of physics is a guarantee of success in any profession.
The assimilation of physics is most effective through activity. The acquisition (consolidation) of knowledge in physics in the 7th grade is facilitated by:
- 1) solution of physical tasks of various types;
- 2) analysis of daily events from the point of view of physics.
Real Reshebnik in physics for grade 7 to the textbook authors L.A. Isachenkova, Yu.D. Leshchinsky 2011 The year of publication provides ample opportunities in such an activity as solving problems, presenting computational, experimental problems, problems with a choice of answers and problems with incomplete conditions.
Each type of tasks has a certain methodological load. So, tasks with incomplete conditions invite the student to become a co-author of the problem, supplement the condition and solve the problem in accordance with the level of their training. This type of task actively develops the creativity of students. Tasks-questions develop thinking, teach the student to see physical phenomena in everyday life.
Applications carry important information both for solving the tasks given in the Handbook, and for solving everyday tasks of a domestic nature. In addition, the analysis of reference data develops thinking, helps to establish the relationship between the properties of substances, allows you to compare the scales of physical quantities, the characteristics of devices and machines.
But the main goal of this manual is to teach the reader to independently acquire knowledge, through solving problems of various types, to deepen the understanding of physical phenomena and processes, to learn the laws and patterns that connect physical quantities.
We wish you success on the difficult path of learning physics.
LAB #5
DETERMINATION OF THE MOMENTS OF INERTIA OF BODIES OF ANY SHAPE
1 Purpose of work
Determination of the moment of inertia of mathematical and physical pendulums.
2 List of devices and accessories
Experimental setup for determining the moments of inertia of mathematical and physical pendulums, ruler.
1-physical pendulum,
2-math pendulum,
4-place for attaching the thread,
5-vertical rack,
6-base,
3 Theoretical part
A mathematical pendulum is a material point suspended on a weightless inextensible thread. The oscillation period of a mathematical pendulum is determined by the formula:
 ,
,
where l- thread length.
A physical pendulum is a rigid body capable of oscillating around a fixed axis that does not coincide with its center of inertia. Oscillations of mathematical and physical pendulums occur under the action of a quasi-elastic force, which is one of the components of gravity.
The reduced length of a physical pendulum is the length of such a mathematical pendulum, in which the period of oscillation coincides with the period of oscillation of the physical pendulum.

The moment of inertia of a body is a measure of inertia during rotational motion. Its value depends on the distribution of body mass relative to the axis of rotation.
The moment of inertia of a mathematical pendulum is calculated by the formula:
 ,
,
where m - mass of a mathematical pendulum, l - the length of the mathematical pendulum.
The moment of inertia of a physical pendulum is calculated by the formula:

4 Experimental results
Determination of the moments of inertia of mathematical and physical pendulums
|
T m, with |
g, m/s 2 |
I m, kgm 2 |
|||||


|
m f, kg |
T f, with |
I f, kgm 2 |
I, kgm 2 |
|||||


Δ t = 0.001s
Δ g = 0.05 m/s 2
Δ π = 0,005
Δ m = 0.0005 kg
Δ l = 0.005 m
I f = 0.324 ± 0.007 kg m 2 ε = 2.104%
Determination of the moment of inertia of a physical pendulum depending on the mass distribution
|
I f, kgm 2 |
I f, kgm 2 |
||||||

I f 1 = 0.422 ± 0.008 kg m 2
I f 2 = 0.279 ± 0.007 kg m 2
I f 3 = 0.187 ± 0.005 kg m 2
I f 4 = 0.110 ± 0.004 kg m 2
I f5 = 0.060 ± 0.003 kg m 2
Conclusion:
In the laboratory work done, I learned how to calculate the moment of inertia of a mathematical pendulum and a physical pendulum, which is in some non-linear dependence on the distance between the suspension point and the center of gravity.
You downloaded this document from the page of the study group ZI-17, FIRT, USATU http:// www. zi-17. nm. en We hope it will help you in your learning. The archive is constantly updated and you can always find something useful on the site. If you have used any material from our site, do not ignore the guest book. There you can leave words of gratitude and wishes to the authors at any time.
Lab #1
The motion of a body in a circle under the influence of gravity and elasticity.
Objective: check the validity of Newton's second law for the motion of a body in a circle under the action of several.
1) weight, 2) thread, 3) a tripod with a clutch and a ring, 4) a sheet of paper, 5) a measuring tape, 6) a clock with a second hand.
Theoretical justification
The experimental setup consists of a load tied on a thread to a tripod ring (Fig. 1). A sheet of paper is placed on the table under the pendulum, on which a circle with a radius of 10 cm is drawn. Center O circle is on the vertical below the suspension point To pendulum. When the load moves along the circle shown on the sheet, the thread describes a conical surface. Therefore, such a pendulum is called conical.
We project (1) onto the coordinate axes X and Y .
(X), (2)
(Y), (3)
where is the angle formed by the thread with the vertical.
Express from the last equation
and substitute into equation (2). Then
If the circulation period T pendulum around a circle of radius K is known from experimental data, then
the period of revolution can be determined by measuring the time t , for which the pendulum makes N revolutions:
As can be seen from figure 1,
, (7)
Fig.1
Fig.2
where h =OK - distance from the suspension point To to the center of the circle O .
Taking into account formulas (5) - (7), equality (4) can be represented as
. (8)
Formula (8) is a direct consequence of Newton's second law. Thus, the first way to verify the validity of Newton's second law is to experimentally verify the identity of the left and right parts of equality (8).
The force imparts centripetal acceleration to the pendulum
Taking into account formulas (5) and (6), Newton's second law has the form
. (9)
Force F measured with a dynamometer. The pendulum is pulled away from the equilibrium position by a distance equal to the radius of the circle R , and take readings of the dynamometer (Fig. 2) Weight of the load m assumed to be known.
Therefore, another way to verify the validity of Newton's second law is to experimentally verify the identity of the left and right parts of equality (9).
work order
Assemble the experimental setup (see Fig. 1), choosing a pendulum length of about 50 cm.
On a sheet of paper, draw a circle with a radius R = 10 s m.
Place a sheet of paper so that the center of the circle is under the vertical suspension point of the pendulum.
measure distance h between the suspension point To and the center of the circle O measuring tape.
h =
5. Drive the conical pendulum along the drawn circle at a constant speed. measure time t , during which the pendulum makes N = 10 turns.
t =
6. Calculate the centripetal acceleration of the load
Calculate
Conclusion.
Lab #2
Validation of Boyle-Mariotte's Law
Objective: experimentally verify the Boyle–Mariotte law by comparing gas parameters in two thermodynamic states.
Equipment, measuring instruments: 1) a device for studying gas laws, 2) a barometer (one per class), 3) a laboratory tripod, 4) a strip of graph paper measuring 300 * 10 mm, 5) a measuring tape.
Theoretical justification
The Boyle–Mariotte law defines the relationship between the pressure and volume of a gas of a given mass at a constant gas temperature. To be convinced of the justice of this law or equality
(1)
enough to measure the pressurep 1 , p 2 gas and its volumeV 1 , V 2 in the initial and final states, respectively. An increase in the accuracy of checking the law is achieved by subtracting the product from both sides of equality (1). Then formula (1) will look like
(2)
or
(3)
The device for studying gas laws consists of two glass tubes 1 and 2 50 cm long, connected to each other by a rubber hose 3 1 m long, a plate with clamps 4 measuring 300 * 50 * 8 mm and a plug 5 (Fig. 1, a). A strip of graph paper is attached to plate 4 between glass tubes. The tube 2 is removed from the base of the device, lowered down and fixed in the leg of the tripod 6. The rubber hose is filled with water. Atmospheric pressure is measured with a barometer in mm Hg. Art.
When the movable tube is fixed in the initial position (Fig. 1, b), the cylindrical volume of gas in the fixed tube 1 can be found by the formula
, (4)
where S is the cross-sectional area of the tube 1u
The initial gas pressure in it, expressed in mm Hg. Art., is the sum of the atmospheric pressure and the pressure of the water column height in tube 2:
mmHg. (5).
where is the difference in water levels in the tubes (in mm.). Formula (5) takes into account that the density of water is 13.6 times less than the density of mercury.
When tube 2 is lifted up and fixed in its final position (Fig. 1, c), the volume of gas in tube 1 decreases:
(6)
where is the length of the air column in the fixed tube 1.
The final gas pressure is found by the formula
mm. rt. Art. (7)
Substituting the initial and final gas parameters into formula (3) allows us to represent the Boyle-Mariotte law in the form
(8)
Thus, verification of the validity of the Boyle-Mariotte law is reduced to an experimental verification of the identity of the left L 8 and right P 8 parts of equality (8).
Work order
7.Measure the difference in water levels in the tubes.
Raise the movable tube 2 even higher and fix it (see Fig. 1, c).
Repeat measurements of the length of the air column in tube 1 and the difference in water levels in the tubes. Record the measurement results.
10. Measure the atmospheric pressure with a barometer.
11. Calculate the left side of equality (8).
Calculate the right side of equality (8).
13. Check the equality (8)
CONCLUSION:
Lab #4
Investigation of a mixed connection of conductors
Objective : experimentally study the characteristics of a mixed connection of conductors.
Equipment, measuring instruments: 1) power supply, 2) key, 3) rheostat, 4) ammeter, 5) voltmeter, 6) connecting wires, 7) three wire resistors with resistances of 1 ohm, 2 ohm and 4 ohm.
Theoretical justification
Many electrical circuits use a mixed conductor connection, which is a combination of series and parallel connections. The simplest mixed resistance connection = 1 ohm, = 2 ohm, = 4 ohm.
a) Resistors R 2 and R 3 are connected in parallel, so the resistance between points 2 and 3
b) In addition, with a parallel connection, the total current flowing into node 2 is equal to the sum of the currents flowing from it.
c) Given that the resistanceR 1 and equivalent resistance are connected in series.
, (3)
and the total resistance of the circuit between points 1 and 3.
.(4)
An electrical circuit for studying the characteristics of a mixed connection of conductors consists of a power source 1, to which a rheostat 3, an ammeter 4 and a mixed connection of three wire resistors R 1, R 2 and R 3 are connected through a key 2. A voltmeter 5 measures the voltage between different pairs of points in the circuit. The diagram of the electric circuit is shown in Figure 3. Subsequent measurements of the current and voltage in the electric circuit will make it possible to check the relations (1) - (4).
Current measurementsIflowing through the resistorR1, and potential equality on it allows you to determine the resistance and compare it with a given value.
. (5)
Resistance can be found from Ohm's law by measuring the potential difference with a voltmeter:
.(6)
This result can be compared with the value obtained from formula (1). The validity of formula (3) is checked by an additional measurement using a voltage voltmeter (between points 1 and 3).
This measurement will also allow you to evaluate the resistance (between points 1 and 3).
.(7)
The experimental values of the resistances obtained by formulas (5) - (7) must satisfy the relation 9;) for a given mixed connection of conductors.
Work order
Assemble the electrical circuit
3. Record the result of the current measurement.
4. Connect a voltmeter to points 1 and 2 and measure the voltage between these points.
5.Record the voltage measurement result
6. Calculate the resistance.
7. Record the resistance measurement result = and compare it with the resistance of the resistor = 1 ohm
8. Connect a voltmeter to points 2 and 3 and measure the voltage between these points
check the validity of formulas (3) and (4).
Ohm
Conclusion:
We experimentally studied the characteristics of a mixed connection of conductors.
Let's check:
Additional task. Make sure that when the conductors are connected in parallel, the equality is true:
Ohm
Ohm
2 course.
Lab #1
Studying the phenomenon of electromagnetic induction
Objective: experimentally prove the Lenz rule that determines the direction of the current during electromagnetic induction.
Equipment, measuring instruments: 1) arcuate magnet, 2) coil-coil, 3) milliammeter, 4) bar magnet.
Theoretical justification
According to the law of electromagnetic induction (or the Faraday-Maxwell law), the EMF of electromagnetic induction E i in a closed loop is numerically equal and opposite in sign to the rate of change of the magnetic flux F through the surface bounded by this contour.
E i \u003d - F ’
To determine the sign of the induction EMF (and, accordingly, the direction of the induction current) in the circuit, this direction is compared with the selected direction of bypassing the circuit.
The direction of the induction current (as well as the magnitude of the induction EMF) is considered positive if it coincides with the selected direction of bypassing the circuit, and is considered negative if it is opposite to the selected direction of bypassing the circuit. We use the Faraday-Maxwell law to determine the direction of the induction current in a circular wire loop with an area S 0 . We assume that at the initial time t 1 =0 the magnetic field induction in the region of the coil is equal to zero. At the next moment in time t 2 = the coil moves into the region of the magnetic field, the induction of which is directed perpendicular to the plane of the coil to us (Fig. 1 b)
For the direction of bypassing the contour, we will choose the direction clockwise. According to the gimlet's rule, the contour area vector will be directed from us perpendicular to the contour area.
The magnetic flux penetrating the circuit in the initial position of the coil is zero (=0):
Magnetic flux in the final position of the coil
Change in magnetic flux per unit of time
Hence, the induction emf, according to formula (1), will be positive:
E i =
This means that the induction current in the circuit will be directed clockwise. Accordingly, according to the gimlet rule for loop currents, the own induction on the axis of such a coil will be directed against the induction of the external magnetic field.
According to Lenz's rule, the induction current in the circuit has such a direction that the magnetic flux created by it through the surface limited by the circuit prevents a change in the magnetic flux that caused this current.
The induction current is also observed when the external magnetic field is strengthened in the plane of the coil without moving it. For example, when a bar magnet moves into a coil, the external magnetic field and the magnetic flux penetrating it increase.
Contour direction
F 1
F 2
ξ i
(sign)
(ex.)
I A
B 1 S 0
B 2 S 0
-(B 2 -B 1)S 0<0
15 mA
Work order
1. Coil - uterus 2 (see Fig. 3) connect to the terminals of the milliammeter.
2. Insert the north pole of the arcuate magnet into the coil along its axis. In subsequent experiments, move the poles of the magnet from the same side of the coil, the position of which does not change.
Check the correspondence of the results of the experiment with table 1.
3. Remove the north pole of the arcuate magnet from the coil. Present the results of the experiment in the table.
Contour direction measure the refractive index of glass using a plane-parallel plate.
Equipment, measuring instruments: 1) a plane-parallel plate with beveled edges, 2) a measuring ruler, 3) a student square.
Theoretical justification
The method of measuring the refractive index using a plane-parallel plate is based on the fact that a beam that has passed through a plane-parallel plate leaves it parallel to the direction of incidence.
According to the law of refraction, the refractive index of the medium
To calculate and on a sheet of paper, two parallel lines AB and CD are drawn at a distance of 5-10 mm from each other and a glass plate is placed on them so that its parallel faces are perpendicular to these lines. With this arrangement of the plate, the parallel straight lines do not shift (Fig. 1, a).
The eye is placed at the level of the table and, following straight lines AB and CD through the glass, the plate is rotated around the vertical axis counterclockwise (Fig. 1, b). The rotation is carried out until the beam QC appears to be a continuation of BM and MQ.
To process the measurement results, outline the contours of the plate with a pencil and remove it from the paper. Through the point M, a perpendicular O 1 O 2 is drawn to the parallel faces of the plate and a straight line MF.
Then, on straight lines BM and MF, equal segments ME 1 \u003d ML 1 are laid off and perpendiculars L 1 L 2 and E 1 E 2 are lowered using a square from points E 1 and L 1 to the straight line O 1 O 2. From right triangles L a) first orient the parallel faces of the plate perpendicular to AB and CD. Make sure the parallel lines don't move. b) place the eye at the level of the table and, following the lines AB and CD through the glass, rotate the plate around the vertical axis counterclockwise until the beam QC appears to be a continuation of BM and MQ. 2. Circle the contours of the plate with a pencil, then remove it from the paper. 3. Through the point M (see Fig. 1,b), draw a perpendicular O 1 O 2 to the parallel faces of the plate and a straight line MF (continuation of MQ) using a square. 4. Centered at point M, draw a circle of arbitrary radius, mark points L 1 and E 1 on straight lines BM and MF (ME 1 \u003d ML 1) 5. Using a square, lower the perpendiculars from points L 1 and E 1 to the line O 1 O 2. 6. Measure the length of the segments L 1 L 2 and E 1 E 2 with a ruler. 7. Calculate the refractive index of glass using formula 2.
 Two heads and six legs; four walk, and two lie still
 Self-esteem - what is it: concept, structure, types and levels
 Cassandra's Path, or Pasta Adventures War on Earth and Underground