Arithmetic mean of numbers formula. How to calculate the arithmetic mean
A simple arithmetic mean is the average term, in determining which the total volume of a given attribute in aggregates data is equally distributed among all units included in this set. So, the average annual production output per worker is such a value of the volume of production that would fall on each employee if the entire volume of output was equally distributed among all employees of the organization. The arithmetic mean simple value is calculated by the formula:
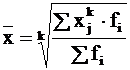
simple arithmetic mean- Equal to the ratio of the sum of individual values of a feature to the number of features in the aggregate
Example 1. A team of 6 workers receives 3 3.2 3.3 3.5 3.8 3.1 thousand rubles per month.
Find the average wage Solution: (3 + 3.2 + 3.3 +3.5 + 3.8 + 3.1) / 6 = 3.32 thousand rubles.
Arithmetic weighted average
If the volume of the data set is large and represents a distribution series, then a weighted arithmetic mean is calculated. This is how the weighted average price per unit of production is determined: the total cost of production (the sum of the products of its quantity and the price of a unit of production) is divided by the total quantity of production.
We represent this in the form of the following formula:
![]()
Weighted arithmetic mean- is equal to the ratio (the sum of the products of the attribute value to the frequency of repetition of this attribute) to (the sum of the frequencies of all the attributes). It is used when the variants of the studied population occur an unequal number of times.
Example 2. Find the average monthly salary of shop workers
|
Salary of one worker thousand rubles; X |
Number of workers F |
The average wage can be obtained by dividing the total wage by the total number of workers:

Answer: 3.35 thousand rubles.
Arithmetic mean for an interval series
When calculating the arithmetic mean for an interval variation series, the average for each interval is first determined as the half-sum of the upper and lower boundaries, and then the average of the entire series. In the case of open intervals, the value of the lower or upper interval is determined by the value of the intervals adjacent to them.
Averages calculated from interval series are approximate.
Example 3. Determine the average age of students in the evening department.
|
Age in years!!x?? |
Number of students |
Interval mean |
The product of the middle of the interval (age) and the number of students |
|
(18 + 20) / 2 =19 18 in this case, the boundary of the lower interval. Calculated as 20 - (22-20) | |||
|
(20 + 22) / 2 = 21 | |||
|
(22 + 26) / 2 = 24 | |||
|
(26 + 30) / 2 = 28 | |||
|
30 or more |
(30 + 34) / 2 = 32 | ||

Averages calculated from interval series are approximate. The degree of their approximation depends on the extent to which the actual distribution of population units within the interval approaches uniform.
When calculating averages, not only absolute, but also relative values (frequency) can be used as weights.
The most important property of the average is that it reflects the common that is inherent in all units of the population under study. The values of the attribute of individual units of the population vary under the influence of many factors, among which there can be both basic and random ones. The essence of the average lies in the fact that it compensates for the deviations of the values of the attribute, which are due to the action of random factors, and accumulates (takes into account) the changes caused by the action of the main factors. This allows the average to reflect the typical level of the attribute and abstract from the individual characteristics inherent in individual units.
In order for the average to be truly typifying, it must be calculated taking into account certain principles.
Basic principles for the use of averages.
1. The average should be determined for populations consisting of qualitatively homogeneous units.
2. The average should be calculated for a population consisting of a sufficiently large number of units.
3. The average should be calculated for the population under stationary conditions (when the influencing factors do not change or change not significantly).
4. The average should be calculated taking into account the economic content of the indicator under study.
The calculation of most specific statistical indicators is based on the use of:
average aggregate;
average power (harmonic, geometric, arithmetic, quadratic, cubic);
average chronological (see section).
All averages, with the exception of the aggregate average, can be calculated in two versions - as weighted or unweighted.
Average aggregate. The formula used is:
where w i= x i* fi;
x i- i-th variant of the averaged feature;
fi, - the weight i- th option.
Average degree. In general, the formula for calculating:
where degree k- a type of average power.
The values of the averages calculated on the basis of the mean exponents for the same initial data are not the same. With an increase in the exponent k, the corresponding average value also increases:
Average chronological. For a momentary dynamic series with equal intervals between dates, it is calculated by the formula:
 ,
,
where x 1 and Xn indicator value for the start and end date.
Formulas for Calculating Power Averages
Example. According to Table. 2.1 it is required to calculate the average salary in general for three enterprises.
Table 2.1
AO enterprises salary
|
Company |
The number of industrial productionpersonnel (PPP), pers. |
monthly fund wages, rub. |
Medium wage, rub. |
|
564840 |
2092 |
||
|
332750 |
2750 |
||
|
517540 |
2260 |
||
|
Total |
1415130 |
The specific calculation formula depends on what data in Table. 7 are original. Accordingly, the following options are possible: data of columns 1 (number of PPP) and 2 (monthly payroll); or - 1 (number of PPP) and 3 (average RFP); or 2 (monthly payroll) and 3 (average salary).
If there is only data for columns 1 and 2. The results of these graphs contain the necessary values for calculating the desired average. The formula of the average aggregate is used:

If there is only data for columns 1 and 3, then the denominator of the original ratio is known, but its numerator is not known. However, the payroll can be obtained by multiplying the average wage by the number of SPPs. Therefore, the overall average can be calculated using the formula arithmetic mean weighted:
It must be taken into account that the weight ( fi) in some cases can be a product of two or even three values.
In addition, the average is also used in statistical practice. arithmetic unweighted:
where n is the volume of the population.
This average is used when the weights ( fi) are absent (each variant of the trait occurs only once) or are equal to each other.
If there is only data for columns 2 and 3., i.e., the numerator of the original ratio is known, but its denominator is not known. The number of PPP of each enterprise can be obtained by dividing the payroll by the average salary. Then the calculation of the average salary for the three enterprises as a whole is carried out according to the formula average harmonic weighted:
![]()
If the weights are equal ( fi) the calculation of the average indicator can be made according to average harmonic unweighted:
In our example, we used different forms of means, but got the same answer. This is due to the fact that for specific data, the same initial ratio of the average was implemented each time.
Averages can be calculated using discrete and interval variation series. In this case, the calculation is made according to the arithmetic weighted average. For a discrete series, this formula is used in the same way as in the example above. In the interval series, the midpoints of the intervals are determined for calculation.
Example. According to Table. 2.2 determine the value of the average per capita cash income per month in a conditional region.
Table 2.2
Initial data (variation series)
| Monthly average per capita cash income, х, rub. | Population, % of total/ |
| Up to 400 | 30,2 |
| 400 — 600 | 24,4 |
| 600 — 800 | 16,7 |
| 800 — 1000 | 10,5 |
| 1000-1200 | 6,5 |
| 1200 — 1600 | 6,7 |
| 1600 — 2000 | 2,7 |
| 2000 and above | 2,3 |
| Total | 100 |
Average values are widely used in statistics. Average values characterize the qualitative indicators of commercial activity: distribution costs, profit, profitability, etc.
Medium This is one of the most common generalizations. A correct understanding of the essence of the average determines its special significance in a market economy, when the average, through a single and random one, makes it possible to identify the general and necessary, to identify the trend of patterns of economic development.
average value - these are generalizing indicators in which they find expression of the action of general conditions, patterns of the phenomenon under study.
Statistical averages are calculated on the basis of mass data of correctly statistically organized mass observation (continuous and selective). However, the statistical average will be objective and typical if it is calculated from mass data for a qualitatively homogeneous population (mass phenomena). For example, if we calculate the average wages in cooperatives and state-owned enterprises, and extend the result to the entire population, then the average is fictitious, since it is calculated for a heterogeneous population, and such an average loses all meaning.
With the help of the average, there is, as it were, a smoothing of differences in the magnitude of the feature that arise for one reason or another in individual units of observation.
For example, the average output of a salesperson depends on many factors: qualifications, length of service, age, form of service, health, and so on.
The average output reflects the general property of the entire population.
The average value is a reflection of the values of the studied trait, therefore, it is measured in the same dimension as this trait.
Each average value characterizes the studied population according to any one attribute. In order to get a complete and comprehensive picture of the population under study in terms of a number of essential features, it is generally necessary to have a system of average values that can describe the phenomenon from different angles.
There are various averages:
arithmetic mean;
geometric mean;
average harmonic;
root mean square;
chronological average.
Consider some types of averages that are most commonly used in statistics.
Arithmetic mean
The simple arithmetic mean (unweighted) is equal to the sum of the individual values of the characteristic, divided by the number of these values.
The individual values of the attribute are called variants and are denoted by x (); the number of population units is denoted by n, the average value of the feature - by  . Therefore, the simple arithmetic mean is:

According to the data of the discrete distribution series, it can be seen that the same values of the attribute (options) are repeated several times. So, variant x occurs in the aggregate 2 times, and variant x - 16 times, etc.
The number of identical values of a feature in the distribution series is called the frequency or weight and is denoted by the symbol n.
Calculate the average wage per worker  in rubles:
The wage bill for each group of workers is equal to the product of options and frequency, and the sum of these products gives the total wage bill of all workers.
In accordance with this, the calculations can be presented in a general form:


The resulting formula is called the weighted arithmetic mean.
Statistical material as a result of processing can be presented not only in the form of discrete distribution series, but also in the form of interval variation series with closed or open intervals.
The calculation of the average for grouped data is carried out according to the weighted arithmetic mean formula:
In the practice of economic statistics, sometimes it is necessary to calculate the average by group averages or by averages of individual parts of the population (partial averages). In such cases, group or partial averages are taken as options (x), on the basis of which the total average is calculated as the usual arithmetic weighted average.
Basic properties of the arithmetic mean .
The arithmetic mean has a number of properties:
1. From a decrease or increase in the frequencies of each value of the attribute x by n times, the value of the arithmetic mean will not change.
If all frequencies are divided or multiplied by some number, then the value of the average will not change.
2. The total multiplier of the individual values of the attribute can be taken out of the sign of the average:

3. The average sum (difference) of two or more quantities is equal to the sum (difference) of their averages:

4. If x \u003d c, where c is a constant value, then  .
.
5. The sum of the deviations of the values of the feature X from the arithmetic mean x is equal to zero:

Average harmonic.
Along with the arithmetic mean, statistics use the harmonic mean, the reciprocal of the arithmetic mean of the reciprocal values of the attribute. Like the arithmetic mean, it can be simple and weighted.
Along with the averages, the characteristics of the variation series are the mode and the median.
Fashion - this is the value of the trait (variant), the most frequently repeated in the studied population. For discrete distribution series, the mode will be the value of the variant with the highest frequency.
For interval distribution series with equal intervals, the mode is determined by the formula:
where  - initial value of the interval containing the mode;
 - the value of the modal interval;
 - modal interval frequency;
 - frequency of the interval preceding the modal;
 - frequency of the interval following the modal.
Median is the variant located in the middle of the variation row. If the distribution series is discrete and has an odd number of members, then the median will be the variant located in the middle of the ordered series (an ordered series is the arrangement of population units in ascending or descending order).
What is the arithmetic mean
The arithmetic mean of several values is the ratio of the sum of these values to their number.
The arithmetic mean of a certain series of numbers is called the sum of all these numbers, divided by the number of terms. Thus, the arithmetic mean is the average value of the number series.
What is the arithmetic mean of several numbers? And they are equal to the sum of these numbers, which is divided by the number of terms in this sum.
How to find the arithmetic mean
There is nothing difficult in calculating or finding the arithmetic mean of several numbers, it is enough to add all the numbers presented, and divide the resulting amount by the number of terms. The result obtained will be the arithmetic mean of these numbers.

Let's consider this process in more detail. What do we need to do to calculate the arithmetic mean and get the final result of this number.
First, to calculate it, you need to determine a set of numbers or their number. This set can include large and small numbers, and their number can be anything.
Secondly, all these numbers need to be added up and get their sum. Naturally, if the numbers are simple and their number is small, then the calculations can be done by writing by hand. And if the set of numbers is impressive, then it is better to use a calculator or spreadsheet.
And, fourthly, the amount obtained from addition must be divided by the number of numbers. As a result, we get the result, which will be the arithmetic mean of this series.

What is the arithmetic mean for?
The arithmetic mean can be useful not only for solving examples and problems in mathematics lessons, but for other purposes necessary in a person’s daily life. Such goals can be the calculation of the arithmetic mean to calculate the average expense of finance per month, or to calculate the time you spend on the road, also in order to find out traffic, productivity, speed, productivity and much more.
So, for example, let's try to calculate how much time you spend commuting to school. Going to school or returning home, you spend different time on the road each time, because when you are in a hurry, you go faster, and therefore the road takes less time. But, returning home, you can go slowly, talking with classmates, admiring nature, and therefore it will take more time for the road.
Therefore, you will not be able to accurately determine the time spent on the road, but thanks to the arithmetic mean, you can approximately find out the time you spend on the road.
Let's say that on the first day after the weekend, you spent fifteen minutes on the way from home to school, on the second day your journey took twenty minutes, on Wednesday you covered the distance in twenty-five minutes, in the same time you made your way on Thursday, and on Friday you were in no hurry and returned for half an hour.
Let's find the arithmetic mean, adding the time, for all five days. So,
15 + 20 + 25 + 25 + 30 = 115
Now divide this amount by the number of days
Through this method, you have learned that the journey from home to school takes approximately twenty-three minutes of your time.
Homework
1. Using simple calculations, find the arithmetic average of the attendance of students in your class per week.
2. Find the arithmetic mean:

3. Solve the problem:

The most common form of statistical indicators used in socio-economic research is the average value, which is a generalized quantitative characteristic of a sign of a statistical population. Average values are, as it were, "representatives" of the entire series of observations. In many cases, the average can be determined through the initial ratio of the average (ISS) or its logical formula: . So, for example, to calculate the average wages of employees of an enterprise, it is necessary to divide the total wage fund by the number of employees: The numerator of the initial ratio of the average is its defining indicator. For the average wage, such a determining indicator is the wage fund. For each indicator used in the socio-economic analysis, only one true reference ratio can be compiled to calculate the average. It should also be added that in order to more accurately estimate the standard deviation for small samples (with the number of elements less than 30), the denominator of the expression under the root should not use n, a n- 1.
The concept and types of averages
Average value- this is a generalizing indicator of the statistical population, which extinguishes individual differences in the values of statistical quantities, allowing you to compare different populations with each other. Exist 2 classes average values: power and structural. Structural averages are fashion and median , but the most commonly used power averages various types.Power averages
Power averages can be simple and weighted.
A simple average is calculated when there are two or more ungrouped statistical values, arranged in an arbitrary order according to the following general formula of the average power law (for different values of k (m)):
The weighted average is calculated from the grouped statistics using the following general formula:
Where x - the average value of the phenomenon under study; x i – i-th variant of the averaged feature ;
f i is the weight of the i-th option.

Where X are the values of individual statistical values or the midpoints of grouping intervals;
m - exponent, on the value of which the following types of power averages depend:
at m = -1 harmonic mean;
for m = 0, the geometric mean;
for m = 1, the arithmetic mean;
at m = 2, the root mean square;
at m = 3, the average cubic.
Using the general formulas for simple and weighted averages at different exponents m, we obtain particular formulas of each type, which will be discussed in detail below.
Arithmetic mean
Arithmetic mean - the initial moment of the first order, the mathematical expectation of the values of a random variable with a large number of trials;
The arithmetic mean is the most commonly used average value, which is obtained by substituting m = 1 into the general formula. Arithmetic mean simple has the following form:
 or
or ![]()
Where X are the values of the quantities for which it is necessary to calculate the average value; N is the total number of X values (the number of units in the studied population).
For example, a student passed 4 exams and received the following grades: 3, 4, 4 and 5. Let's calculate the average score using the simple arithmetic mean formula: (3+4+4+5)/4 = 16/4 = 4. Arithmetic mean weighted has the following form:

Where f is the number of values with the same X value (frequency). >For example, a student passed 4 exams and received the following grades: 3, 4, 4 and 5. Calculate the average score using the arithmetic weighted average formula: (3*1 + 4*2 + 5*1)/4 = 16/4 = 4 . If the X values are given as intervals, then the midpoints of the X intervals are used for calculations, which are defined as half the sum of the upper and lower boundaries of the interval. And if the interval X does not have a lower or upper limit (open interval), then to find it, the range (the difference between the upper and lower limits) of the adjacent interval X is used. For example, at the enterprise there are 10 employees with work experience up to 3 years, 20 - with work experience from 3 to 5 years, 5 employees - with work experience of more than 5 years. Then we calculate the average length of service of employees using the arithmetic weighted average formula, taking as X the middle of the length of service intervals (2, 4 and 6 years): (2*10+4*20+6*5)/(10+20+5) = 3.71 years.
AVERAGE function
This function calculates the average (arithmetic) of its arguments.
AVERAGE(number1, number2, ...)
Number1, number2, ... are 1 to 30 arguments for which the average is calculated.
Arguments must be numbers or names, arrays or references containing numbers. If the argument, which is an array or a link, contains texts, booleans, or empty cells, then those values are ignored; however, cells that contain null values are counted.
AVERAGE function
Calculates the arithmetic mean of the values given in the argument list. In addition to numbers, text and logical values, such as TRUE and FALSE, can participate in the calculation.
AVERAGE(value1, value2,...)
Value1, value2,... are 1 to 30 cells, cell ranges, or values for which the average is calculated.
Arguments must be numbers, names, arrays, or references. Arrays and links containing text are interpreted as 0 (zero). Empty text ("") is interpreted as 0 (zero). Arguments containing the value TRUE are interpreted as 1, Arguments containing the value FALSE are interpreted as 0 (zero).
The arithmetic mean is used most often, but there are times when other types of averages are needed. Let's consider such cases further.
Average harmonic
Harmonic mean for determining the average sum of reciprocals;
Average harmonic is used when the original data do not contain frequencies f for individual values of X, but are presented as their product Xf. Denoting Xf=w, we express f=w/X, and substituting these designations into the weighted arithmetic mean formula, we obtain the weighted harmonic mean formula:
Thus, the harmonic weighted average is used when the frequencies f are unknown, but w=Xf is known. In cases where all w=1, that is, the individual values of X occur 1 time, the harmonic simple mean formula is applied:  or
or  For example, a car was traveling from point A to point B at a speed of 90 km/h and back at a speed of 110 km/h. To determine the average speed, we apply the harmonic simple formula, since the example gives the distance w 1 \u003d w 2 (the distance from point A to point B is the same as from B to A), which is equal to the product of speed (X) and time ( f). Average speed = (1+1)/(1/90+1/110) = 99 km/h.
SRHARM function
Returns the harmonic mean of the data set. The harmonic mean is the reciprocal of the arithmetic mean of reciprocals.
SGARM(number1, number2, ...)
Number1, number2, ... are 1 to 30 arguments for which the average is calculated. You can use an array or an array reference instead of semicolon-separated arguments.
The harmonic mean is always less than the geometric mean, which is always less than the arithmetic mean.
Geometric mean
Geometric mean for estimating the average growth rate of random variables, finding the value of a feature equidistant from the minimum and maximum values;
Geometric mean used in determining average relative changes. The geometric mean value gives the most accurate averaging result if the task is to find such a value of X, which would be equidistant from both the maximum and minimum values of X. For example, between 2005 and 2008inflation index in Russia was: in 2005 - 1.109; in 2006 - 1,090; in 2007 - 1,119; in 2008 - 1,133. Since the inflation index is a relative change (dynamic index), then you need to calculate the average value using the geometric mean: (1.109 * 1.090 * 1.119 * 1.133) ^ (1/4) = 1.1126, that is, for the period from 2005 to 2008 annually prices grew by an average of 11.26%. An erroneous calculation on the arithmetic mean would give an incorrect result of 11.28%.SRGEOM function
Returns the geometric mean of an array or range of positive numbers. For example, the CAGEOM function can be used to calculate the average growth rate if compound income with variable rates is given.
SRGEOM(number1; number2; ...)
Number1, number2, ... are 1 to 30 arguments for which the geometric mean is calculated. You can use an array or an array reference instead of semicolon-separated arguments.
root mean square
The root mean square is the initial moment of the second order.
root mean square is used when the initial values of X can be both positive and negative, for example, when calculating average deviations.Average cubic
The average cubic is the initial moment of the third order.
Average cubic is used extremely rarely, for example, when calculating poverty indices for developing countries (HPI-1) and for developed countries (HPI-2), proposed and calculated by the UN. Two heads and six legs; four walk, and two lie still
 Self-esteem - what is it: concept, structure, types and levels
 Cassandra's Path, or Pasta Adventures War on Earth and Underground