Fractals in prime numbers. Man with spatial imagination
What do a tree, a seashore, a cloud, or blood vessels in our hand have in common? At first glance, it may seem that all these objects have nothing in common. However, in fact, there is one property of the structure that is inherent in all the listed objects: they are self-similar. From the branch, as well as from the trunk of a tree, smaller processes depart, from them - even smaller ones, etc., that is, a branch is similar to the whole tree. The circulatory system is arranged in a similar way: arterioles depart from the arteries, and from them - the smallest capillaries through which oxygen enters organs and tissues. Let's look at satellite images of the sea coast: we will see bays and peninsulas; let's take a look at it, but from a bird's eye view: we will see bays and capes; now imagine that we are standing on the beach and looking at our feet: there will always be pebbles that protrude further into the water than the rest. That is, the coastline remains similar to itself when zoomed in. American mathematician Benoit Mandelbrot called this property of objects fractality, and such objects themselves - fractals (from the Latin fractus - broken).
This concept does not have a strict definition. Therefore, the word "fractal" is not a mathematical term. Usually, a fractal is a geometric figure that satisfies one or more of the following properties: It has a complex structure at any magnification (unlike, for example, a straight line, any part of which is the simplest geometric figure - a segment). It is (approximately) self-similar. It has a fractional Hausdorff (fractal) dimension, which is larger than the topological one. Can be built with recursive procedures.
Geometry and Algebra
The study of fractals at the turn of the 19th and 20th centuries was more episodic than systematic, because earlier mathematicians mainly studied “good” objects that could be studied using common methods and theories. In 1872, German mathematician Karl Weierstrass builds an example of a continuous function that is nowhere differentiable. However, its construction was entirely abstract and difficult to understand. Therefore, in 1904, the Swede Helge von Koch came up with a continuous curve that has no tangent anywhere, and it is quite simple to draw it. It turned out that it has the properties of a fractal. One variation of this curve is called the Koch snowflake.
The ideas of self-similarity of figures were picked up by the Frenchman Paul Pierre Levy, the future mentor of Benoit Mandelbrot. In 1938, his article “Plane and Spatial Curves and Surfaces Consisting of Parts Similar to the Whole” was published, in which another fractal is described - the Lévy C-curve. All these fractals listed above can be conditionally attributed to one class of constructive (geometric) fractals.

Another class is dynamic (algebraic) fractals, which include the Mandelbrot set. The first research in this direction began at the beginning of the 20th century and is associated with the names of the French mathematicians Gaston Julia and Pierre Fatou. In 1918, Julia published a memoir of almost two hundred pages, devoted to iterations of complex rational functions, in which Julia sets are described - a whole family of fractals closely related to the Mandelbrot set. This work was awarded the prize of the French Academy, but it did not contain a single illustration, so it was impossible to appreciate the beauty of the discovered objects. Despite the fact that this work made Julia famous among the mathematicians of the time, it was quickly forgotten. Again, attention turned to it only half a century later with the advent of computers: it was they who made visible the richness and beauty of the world of fractals.
Fractal dimensions

As you know, the dimension (number of measurements) of a geometric figure is the number of coordinates necessary to determine the position of a point lying on this figure.
For example, the position of a point on a curve is determined by one coordinate, on a surface (not necessarily a plane) by two coordinates, in three-dimensional space by three coordinates.
From a more general mathematical point of view, one can define the dimension in this way: an increase in linear dimensions, say, twice, for one-dimensional (from a topological point of view) objects (segment) leads to an increase in size (length) by a factor of two, for two-dimensional (square ) the same increase in linear dimensions leads to an increase in size (area) by 4 times, for three-dimensional (cube) - by 8 times. That is, the “real” (so-called Hausdorff) dimension can be calculated as the ratio of the logarithm of the increase in the “size” of an object to the logarithm of the increase in its linear size. That is, for a segment D=log (2)/log (2)=1, for a plane D=log (4)/log (2)=2, for a volume D=log (8)/log (2)=3.
Let us now calculate the dimension of the Koch curve, for the construction of which the unit segment is divided into three equal parts and the middle interval is replaced by an equilateral triangle without this segment. With an increase in the linear dimensions of the minimum segment three times, the length of the Koch curve increases in log (4) / log (3) ~ 1.26. That is, the dimension of the Koch curve is fractional!
Science and art
In 1982, Mandelbrot's book "The Fractal Geometry of Nature" was published, in which the author collected and systematized almost all the information about fractals available at that time and presented it in an easy and accessible manner. Mandelbrot made the main emphasis in his presentation not on ponderous formulas and mathematical constructions, but on the geometric intuition of readers. Thanks to computer generated illustrations and historical stories, with which the author skillfully diluted the scientific component of the monograph, the book became a bestseller, and the fractals became known to the general public. Their success among non-mathematicians is largely due to the fact that with the help of very simple constructions and formulas that even a high school student can understand, images of amazing complexity and beauty are obtained. When personal computers became powerful enough, even a whole trend in art appeared - fractal painting, and almost any computer owner could do it. Now on the Internet you can easily find many sites dedicated to this topic.
 Scheme for obtaining the Koch curve
War and Peace
As noted above, one of the natural objects that have fractal properties is the coastline. One interesting story is connected with it, or rather, with an attempt to measure its length, which formed the basis of Mandelbrot's scientific article, and is also described in his book "The Fractal Geometry of Nature". We are talking about an experiment that was set up by Lewis Richardson, a very talented and eccentric mathematician, physicist and meteorologist. One of the directions of his research was an attempt to find a mathematical description of the causes and likelihood of an armed conflict between two countries. Among the parameters that he took into account was the length of the common border between the two warring countries. When he collected data for numerical experiments, he found that in different sources the data on the common border of Spain and Portugal differ greatly. This led him to the following discovery: the length of the country's borders depends on the ruler with which we measure them. The smaller the scale, the longer the border will be. This is due to the fact that at higher magnification it becomes possible to take into account more and more bends of the coast, which were previously ignored due to the roughness of measurements. And if, with each zoom, previously unaccounted bends of lines are opened, then it turns out that the length of the borders is infinite! True, in fact this does not happen - the accuracy of our measurements has final limit. This paradox is called the Richardson effect.

Constructive (geometric) fractals
The algorithm for constructing a constructive fractal in the general case is as follows. First of all, we need two suitable geometric shapes, let's call them the base and the fragment. At the first stage, the basis of the future fractal is depicted. Then some of its parts are replaced by a fragment taken in a suitable scale - this is the first iteration of the construction. Then, in the resulting figure, some parts again change to figures similar to a fragment, and so on. If we continue this process indefinitely, then in the limit we get a fractal.
Consider this process using the example of the Koch curve (see sidebar on the previous page). Any curve can be taken as the basis of the Koch curve (for the Koch snowflake, this is a triangle). But we confine ourselves to the simplest case - a segment. The fragment is a broken line shown on the top of the figure. After the first iteration of the algorithm, in this case, the original segment will coincide with the fragment, then each of its constituent segments will itself be replaced by a broken line similar to the fragment, and so on. The figure shows the first four steps of this process.

The language of mathematics: dynamic (algebraic) fractals
Fractals of this type arise in the study of nonlinear dynamical systems (hence the name). The behavior of such a system can be described by a complex nonlinear function (polynomial) f(z). Let us take some initial point z0 on the complex plane (see sidebar). Now consider such an infinite sequence of numbers on the complex plane, each of which is obtained from the previous one: z0, z1=f (z0), z2=f (z1), … zn+1=f (zn). Depending on the initial point z0, such a sequence can behave differently: tend to infinity as n -> ∞; converge to some end point; cyclically take a number of fixed values; more complex options are possible.
Complex numbers
A complex number is a number consisting of two parts - real and imaginary, that is, the formal sum x + iy (x and y here - real numbers). i is the so-called. imaginary unit, that is, that is, a number that satisfies the equation i^ 2 = -1. Over complex numbers, the main mathematical operations- addition, multiplication, division, subtraction (only the comparison operation is not defined). Often used to display complex numbers geometric representation- on the plane (it is called complex), the real part is plotted along the abscissa axis, and the imaginary part along the ordinate axis, while the complex number will correspond to a point with Cartesian coordinates x and y.
Thus, any point z of the complex plane has its own character of behavior during iterations of the function f (z), and the entire plane is divided into parts. Moreover, the points lying on the boundaries of these parts have the following property: for an arbitrarily small displacement, the nature of their behavior changes dramatically (such points are called bifurcation points). So, it turns out that sets of points that have one specific type of behavior, as well as sets of bifurcation points, often have fractal properties. These are the Julia sets for the function f(z).
dragon family

By varying the base and fragment, you can get a stunning variety of constructive fractals.
Moreover, similar operations can be performed in three-dimensional space. Examples of volumetric fractals are "Menger's sponge", "Sierpinski's pyramid" and others.
The family of dragons is also referred to constructive fractals. They are sometimes referred to by the name of the discoverers as the "dragons of Heiwei-Harter" (they resemble Chinese dragons in their shape). There are several ways to construct this curve. The simplest and most obvious of them is this: you need to take a sufficiently long strip of paper (the thinner the paper, the better), and bend it in half. Then again bend it in half in the same direction as the first time. After several repetitions (usually after five or six folds, the strip becomes too thick to be carefully bent further), you need to straighten the strip back, and try to form 90˚ angles at the folds. Then the curve of the dragon will turn out in profile. Of course, this will only be an approximation, like all our attempts to depict fractal objects. The computer allows you to depict many more steps in this process, and the result is a very beautiful figure.
The Mandelbrot set is constructed somewhat differently. Consider the function fc (z) = z 2 +c, where c is a complex number. Let us construct a sequence of this function with z0=0, depending on the parameter c, it can diverge to infinity or remain bounded. Moreover, all values of c for which this sequence is bounded form the Mandelbrot set. It was studied in detail by Mandelbrot himself and other mathematicians, who discovered many interesting properties of this set.
It can be seen that the definitions of the Julia and Mandelbrot sets are similar to each other. In fact, these two sets are closely related. Namely, the Mandelbrot set is all values of the complex parameter c for which the Julia set fc (z) is connected (a set is called connected if it cannot be divided into two non-intersecting parts, with some additional conditions).

fractals and life
Nowadays, the theory of fractals is widely used in various fields of human activity. In addition to a purely scientific object for research and the already mentioned fractal painting, fractals are used in information theory to compress graphic data (here, the self-similarity property of fractals is mainly used - after all, in order to remember a small fragment of a drawing and transformations with which you can get the rest of the parts, it takes much less memory than to store the entire file). By adding random perturbations to the formulas that define the fractal, you can get stochastic fractals that very plausibly convey some real objects - relief elements, the surface of water bodies, some plants, which is successfully used in physics, geography and computer graphics to achieve greater similarity of simulated objects with real. In radio electronics last decade began to produce antennas having a fractal shape. Taking up little space, they provide quite high-quality signal reception. Economists use fractals to describe currency fluctuation curves (this property was discovered by Mandelbrot over 30 years ago). This concludes this short excursion into the world of fractals, amazing in its beauty and diversity.
When I do not understand everything in what I read, I am not particularly upset. If the topic does not come across to me later, then it is not very important (at least for me). If the topic meets again, for the third time, I will have new chances to better understand it. Fractals are among such topics. I first learned about them from a book by Nassim Taleb, and then in more detail from a book by Benoit Mandelbrot. Today, on the request "fractal" on the site, you can get 20 notes.
Part I. A JOURNEY TO THE ORIGINS
TO NAME IS TO KNOW. As far back as the beginning of the 20th century, Henri Poincaré remarked: “You are surprised at the power that one word can have. Here is an object about which nothing could be said until it was baptized. It was enough to give him a name for a miracle to happen ”(see also). And so it happened when, in 1975, the French mathematician of Polish origin, Benoit Mandelbrot, collected the Word. From Latin words frangere(break) and fractus(discontinuous, discrete, fractional) a fractal has formed. Mandelbrot skillfully promoted and propagated the fractal as a brand based on emotional appeal and rational utility. He publishes several monographs, including The Fractal Geometry of Nature (1982).
FRACTALS IN NATURE AND ART. Mandelbrot outlined the contours of a fractal geometry other than Euclidean. The difference did not apply to the axiom of parallelism, as in the geometries of Lobachevsky or Riemann. The difference was the rejection of Euclid's default requirement for smoothness. Some objects are inherently rough, porous or fragmented, and many of them have these properties "to the same extent at any scale." In nature, there is no shortage of such forms: sunflowers and broccoli, sea shells, ferns, snowflakes, mountain crevices, coastlines, fjords, stalagmites and stalactites, lightning.
People who are attentive and observant have long noticed that some forms show a repetitive structure when viewed "up close or from afar." Approaching such objects, we notice that only minor details change, but the shape as a whole remains almost unchanged. Based on this, the fractal is easiest to define as a geometric shape that contains repeating elements at any scale.
MYTHS AND MYSTIFICATIONS. The new layer of forms discovered by Mandelbrot became a gold mine for designers, architects, and engineers. An uncountable number of fractals are built according to the same principles of multiple repetition. From here, the fractal is easiest to define as a geometric shape that contains repeating elements at any scale. This geometric form is locally unchanging (invariant), self-similar on a scale and integral in its limitations, a true singularity, the complexity of which is revealed as it approaches, and triviality itself at a distance.
DEVIL'S LADDER. Extremely strong electrical signals are used to transfer data between computers. Such a signal is discrete. Interference or noise randomly occurs in electrical networks due to many reasons and leads to data loss when information is transmitted between computers. To eliminate the influence of noise on data transmission in the early sixties of the last century was entrusted to a group of IBM engineers, in which Mandelbrot took part.
A rough analysis showed the presence of periods during which no errors were recorded. Having singled out periods lasting an hour, the engineers noticed that between them the periods of signal passage without errors are also intermittent; there are shorter pauses lasting about twenty minutes. Thus, data transmission without errors is characterized by data packets of different lengths and pauses in noise, during which the signal is transmitted without errors. In packages of a higher rank, as it were, packages of a lower rank are built in. Such a description implies the existence of such a thing as the relative position of lower-ranking packets in a higher-ranking packet. Experience has shown that the probability distribution of these relative locations of packages is independent of their rank. This invariance indicates the self-similarity of the process of data distortion under the action of electrical noise. The very procedure for cutting out error-free pauses in a signal during data transmission could not occur to electrical engineers for the reason that this was new to them.
But Mandelbrot, who studied pure mathematics, was well aware of the Cantor set, described back in 1883 and representing dust from points obtained according to a strict algorithm. The essence of the algorithm for constructing "Cantor's dust" is as follows. Take a straight line. Remove the middle third of the segment from it, keeping the two end ones. Now we repeat the same operation with the end segments and so on. Mandelbrot discovered that this is precisely the geometry of packets and pauses in the transmission of signals between computers. The error is cumulative. Its accumulation can be modeled as follows. At the first step, we assign the value 1/2 to all points from the interval, at the second step from the interval the value 1/4, the value 3/4 to the points from the interval, etc. Step-by-step summation of these quantities makes it possible to construct the so-called "devil's ladder" (Fig. 1). The measure of "Cantor's dust" is an irrational number equal to 0.618... known as " golden ratio or Divine Proportion.

Part II. FRACTALS ARE THE MATTER
SMILE WITHOUT A CAT: FRACTAL DIMENSION. Dimension is one of the fundamental concepts that goes far beyond mathematics. Euclid in the first book of the "Beginnings" defined the basic concepts of geometry point, line, plane. Based on these definitions, the concept of three-dimensional Euclidean space remained unchanged for almost two and a half thousand years. Numerous flirting with spaces of four, five and more dimensions essentially add nothing, but they face what the human imagination cannot imagine. With the discovery of fractal geometry, a radical revolution took place in the concept of dimension. A great variety of dimensions appeared, and among them are not only integers, but also fractional, and even irrational ones. And these dimensions are available for visual and sensual representation. Indeed, we can easily imagine cheese with holes as a model of a medium whose dimension is more than two, but falls short of three due to cheese holes, which reduces the dimension of the cheese mass.
To understand fractional or fractal dimension, let's turn to Richardson's paradox, which claimed that the length of Britain's rugged coastline is infinite! Louis Fry Richardson wondered about the effect of the scale of measurement on the magnitude of the measured length of the British coastline. When moving from the scale of contour maps to the scale of "coastal pebbles", he came to a strange and unexpected conclusion: the length of the coastline increases indefinitely, and this increase has no limit. Smooth curved lines don't behave like this. Richardson's empirical data, obtained on maps of increasingly larger scales, testified to a power-law increase in the length of the coastline with a decrease in the measurement step:
In this simple Richardson formula L is the measured length of the coast, ε is the value of the measurement step, and β ≈ 3/2 is the degree of growth of the coast length found by him with a decrease in the measurement step. Unlike the circumference, the length of the UK coastline increases without having a 55 limit. She is endless! One has to come to terms with the fact that the curves are broken, non-smooth, do not have a limiting length.
However, Richardson's studies suggested that they have some characteristic measure of the degree of growth in length with decreasing measurement scale. It turned out that it is this value that mystically identifies a broken line as a fingerprint of a person's personality. Mandelbrot interpreted the coastline as a fractal object - an object whose dimension coincides with the exponent β.
For example, the dimensions of the coastal boundary curves for the western coast of Norway are 1.52; for the UK - 1.25; for Germany - 1.15; for Australia - 1.13; for a relatively smooth coast of South Africa - 1.02 and, finally, for a perfectly smooth circle - 1.0.
Looking at a fragment of a fractal, you will not be able to tell what its dimension is. And the reason is not in the geometric complexity of the fragment, the fragment can be very simple, but in the fact that the fractal dimension reflects not only the shape of the fragment, but also the format of the fragment transformation in the process of constructing the fractal. The fractal dimension is, as it were, removed from the form. And thanks to this, the value of the fractal dimension remains invariant; it is the same for any fragment of the fractal at any viewing scale. It cannot be “grabbed with fingers”, but it can be calculated.
FRACTAL REPEAT. Repetition can be modeled with non-linear equations. Linear equations are characterized by a one-to-one correspondence of variables: each value X matches one and only one value at and vice versa. For example, the equation x + y = 1 is linear. The behavior of linear functions is completely determined, uniquely determined by the initial conditions. The behavior of non-linear functions is not so unambiguous, because two different initial conditions can lead to the same result. On this basis, the iteration of the repetition of the operation appears in two different formats. It can have the character of a linear reference, when at each step of the calculations there is a return to the initial condition. This is a kind of "pattern iteration". Serial production on the assembly line is "pattern iteration". Iteration in the format of linear reference does not depend on the intermediate states of the evolution of the system. Here, each new iteration starts "from the stove." It is quite a different matter when the iteration has a recursion format, i.e. the result of the previous iteration step becomes the initial condition for the next one.
The recursion can be illustrated with a Fibonacci series, represented in the form of a Girard sequence:
u n +2 = u n +1 + u n
The result is the Fibonacci numbers:
1, 1, 2, 3, 5, 8, 13, 21, 34, 55…
In this example, it is quite clear that the function is applied to itself without referencing the initial value. It sort of slides along the Fibonacci series, and each result of the previous iteration becomes the starting value for the next one. It is this repetition that is realized in the construction of fractal forms.
Let us show how the fractal repetition is implemented in the algorithms for constructing the “Sierpinski napkin” (using the cutting method and the CIF method).
cutting method. Take an equilateral triangle with a side r. At the first step, we cut out in the center of it an equilateral triangle turned upside down with a side length r 1 = r 0/2. As a result of this step, we get three equilateral triangles with side lengths r 1 = r 0 /2 located at the vertices of the original triangle (Fig. 2).

At the second step, in each of the three triangles formed, we cut out inverted inscribed triangles with a side length r 2 = r 1 /2 = r 0 /4. Result - 9 triangles with side length r 2 = r 0 /4. As a result, the shape of the "Sierpinski napkin" gradually becomes more and more defined. Fixation occurs at every step. All previous fixations are sort of "erased".
Method SIF, or Barnsley's Method of Systems of Iterated Functions. Given: an equilateral triangle with the coordinates of the angles A (0.0), B (1.0), C (1/2, √3/2). Z 0 is an arbitrary point inside this triangle (Fig. 3). We take a dice, on the sides of which there are two letters A, B and C.
Step 1. Throw the bone. The probability of getting each letter is 2/6 = 1/3.
- If the letter A falls out, we build a segment z 0 -A, in the middle of which we put a point z 1
- If the letter B falls out, we build a segment z 0 -B, in the middle of which we put a point z 1
- If the letter C falls out, we build a segment z 0 -C, in the middle of which we put a point z 1
Step 2. Throw the bone again.
- If the letter A falls out, we build a segment z 1 -A, in the middle of which we put a point z 2
- If the letter B falls out, we build a segment z 1 -B, in the middle of which we put a point z 2
- If the letter C falls out, we build a segment z 1 -C, in the middle of which we put a point z 2

Repeating the operation many times, we will get points z 3 , z 4 , …, z n . The peculiarity of each of them is that the point is exactly halfway from the previous one to an arbitrarily chosen vertex. Now, if we discard the initial points, for example, from z 0 to z 100 , then the rest, with a sufficiently large number of them, form the “Sierpinski napkin” structure. The more points, the more iterations, the more clearly the Sierpinski fractal appears to the observer. And this despite the fact that the process goes, it would seem, in a random way (thanks to the dice). The “Sierpinski napkin” is a kind of process attractor, that is, a figure to which all trajectories built in this process with a sufficiently large number of iterations tend. Fixing the image in this case is a cumulative, accumulative process. Each individual point, perhaps, will never coincide with the point of the Sierpinski fractal, but each subsequent point of this process organized “by chance” is attracted closer and closer to the points of the “Sierpinski napkin”.
FEEDBACK LOOP. The founder of cybernetics, Norbert Wiener, cited the helmsman on a boat as an example to describe the feedback loop. The helmsman must stay on course and is constantly assessing how well the boat is keeping to it. If the helmsman sees that the boat is deviating, he turns the helm to return it to a given course. After a while, he again evaluates and again corrects the direction of movement using the steering wheel. Thus, navigation is carried out using iterations, repetition and successive approximation of the movement of the boat to a given course.
A typical feedback loop diagram is shown in fig. 4 It comes down to changing the variable parameters (the direction of the boat) and the controlled parameter C (the course of the boat).

Consider the mapping "Bernoulli shift". Let some number belonging to the interval from 0 to 1 be chosen as the initial state. Let's write this number in the binary number system:
x 0 \u003d 0.01011010001010011001010 ...
Now one step of evolution in time is that the sequence of zeros and ones is shifted to the left by one position, and the digit that happened to be on the left side of the decimal point is discarded:
x 1 \u003d 0.1011010001010011001010 ...
x 2 \u003d 0.011010001010011001010 ...
x 3 \u003d 0.11010001010011001010 ...
Note that if the original numbers x 0 rational, then in the process of iteration the values Xn go into a periodic orbit. For example, for the initial number 11/24, in the process of iteration, we get a series of values:
11/24 -> 11/12 -> 5/6 -> 2/3 -> 1/3 -> 2/3 -> 1/3 -> …
If the original values x0 are irrational, the mapping will never reach the periodic mode. The interval of initial values x 0 ∈ contains infinitely many rational points and infinitely many irrational points. Thus, the density of periodic orbits is equal to the density of orbits that never reach the periodic regime. In any neighborhood of rational value x0 there is an irrational value of the initial parameter x' 0 In this state of affairs, a subtle sensitivity to initial conditions. This is hallmark that the system is in a state of dynamic chaos.
ELEMENTARY FEEDBACK LOOP. Reverse is necessary condition and the consequence of every side glance that takes itself by surprise. The icon of the reverse loop can be the Möbius strip, in which its lower side passes into the upper one with each circle, the inner becomes outer and vice versa. The accumulation of differences during the reverse process first leads the image away from the original, and then returns to it. In logic, the reversal loop is illustrated by Epimenides' paradox: "all Cretans are liars." But Epimenides himself is a Cretan.
STRANGE LOOP. The dynamic essence of the phenomenon of a strange loop is that the image, being transformed and more and more different from the original one, returns to the original image in the process of numerous deformations, but never repeats it exactly. Describing this phenomenon, Hofstadter introduces the term "strange loop" in the book. He concludes that both Escher, Bach, and Gödel discovered or, more precisely, used strange loops in their work and creativity in the visual arts, music, and mathematics, respectively. Escher, in Metamorphoses, discovered the strange coherence of the various planes of reality. The forms of one of the artistic perspectives are plastically transformed into the forms of another artistic perspective (Fig. 5).

Rice. 5. Maurits Escher. Drawing hands. 1948
Such strangeness manifested itself in a bizarre way in music. One of the canons of Bach's Musical Offering ( Canon per Tonos- Tonal canon) is constructed in such a way that its apparent ending unexpectedly smoothly passes into the beginning, but with a shift in tone. These successive modulations take the listener higher and higher from the original pitch. However, miraculously, after six modulations we are almost back. All voices now sound exactly one octave higher than at the beginning. The only strange thing is that as we rise through the levels of a certain hierarchy, we suddenly find ourselves in almost the same place where we started our journey - return without repeat.
Kurt Gödel discovered strange loops in one of the most ancient and mastered areas of mathematics - in number theory. Gödel's theorem first saw the light as Theorem VI in his 1931 paper "On formally undecidable propositions" in Principle Mathematica. The theorem states the following: all consistent axiomatic formulations of number theory contain undecidable propositions. The judgments of number theory say nothing about the judgments of number theory; they are nothing more than judgments of number theory. There is a loop here, but no weirdness. A strange loop is hidden in the proof.
STRANGE ATTRACTOR. Attractor (from English. attract attract) point or closed line, which attracts to itself all possible trajectories of the system's behavior. The attractor is stable, that is, in the long run, the only possible behavior is the attractor, everything else is temporary. An attractor is a spatio-temporal object covering the entire process, being neither its cause nor its effect. It is formed only by systems with a limited number of degrees of freedom. Attractors can be a point, a circle, a torus, and a fractal. AT last case the attractor is called "strange" (Fig. 6).

A point attractor describes any stable state of the system. In phase space, it is a point around which local trajectories of a "node", "focus" or "saddle" are formed. This is how the pendulum behaves: for any initial speed and any initial position after a sufficient time under the action of friction, the pendulum stops and comes to a state of stable equilibrium. A circular (cyclic) attractor is a movement back and forth, like an ideal pendulum (without friction), in a circle.
Strange attractors ( strange attractors) seem strange only from the outside, but the term " strange attractor” spread immediately after the appearance in 1971 of the article “The Nature of Turbulence” by David Ruel and the Dutchman Floris Takens (see also). Ruelle and Takens wondered if any attractor has the right set of characteristics: stability, a limited number of degrees of freedom, and non-periodicity. With geometric point view the question seemed like a pure puzzle. What form should an infinitely extended trajectory, drawn in a limited space, have in order to never repeat or intersect itself? To reproduce each rhythm, the orbit must be an infinitely long line on limited area in other words, be self-swallowing (Figure 7).

By 1971, there was already one sketch of such an attractor in the scientific literature. Eduard Lorentz made it an appendix to his 1963 paper on deterministic chaos. This attractor was stable, non-periodic, had a small number of degrees of freedom, and never crossed itself. If this happened, and he returned to a point that he had already passed, the movement would be repeated in the future, forming a toroidal attractor, but this did not happen.
The strangeness of the attractor lies, as Ruel believed, in three non-equivalent, but in practice signs that exist together:
- fractality (nesting, similarity, consistency);
- determinism (dependence on initial conditions);
- singularities (a finite number of defining parameters).
Part III. IMAGINARY LIGHTNESS OF FRACTAL FORMS
IMAGINARY NUMBERS, PHASE PORTRAITS AND PROBABILITY. Fractal geometry is based on the theory of imaginary numbers, dynamical phase portraits and probability theory. The theory of imaginary numbers admits that there is Square root from minus one. Gerolamo Cardano in his work "The Great Art" ("Ars Magna", 1545) presented the general solution of the cubic equation z 3 + pz + q = 0. Cardano uses imaginary numbers as a means of technical formalism to express the roots of the equation. He notices an oddity which he illustrates simple equation x 3 \u003d 15x + 4. This equation has one obvious solution: x \u003d 4. However, the generalizing formula gives a strange result. It contains the root of a negative number:
Rafael Bombelli in his book on algebra ("L'Algebra", 1560) pointed out that = 2 ± i, and this immediately allowed him to obtain a real root x = 4. In such cases, when complex numbers are conjugate, a real root is obtained , and complex numbers serve as a technical aid in the process of obtaining a solution to a cubic equation.
Newton believed that solutions containing a root of minus one should be considered "not having physical sense' and discard. In the XVII-XVIII centuries, an understanding was formed that something imaginary, spiritual, imaginary is no less real than everything real taken together. We can even give the exact date of November 10, 1619, when Descartes formulated the manifesto of the new thinking "cogito ergo sum". From this moment on, thought is an absolute and undoubted reality: “if I think, then it means that I exist”! More precisely thought is now perceived as reality. Descartes' idea of an orthogonal coordinate system, thanks to imaginary numbers, finds its completion. Now it is possible to fill these imaginary numbers with meanings.
In the 19th century, the works of Euler, Argan, Cauchy, Hamilton developed an arithmetic apparatus for working with complex numbers. Any complex number can be represented as the sum of X + iY, where X and Y are real numbers familiar to us, and i imaginary unit (essentially it is √–1). Each complex number corresponds to a point with coordinates (X, Y) on the so-called complex plane.
The second important concept, the phase portrait of a dynamical system, was formed in the 20th century. After Einstein showed that everything moves at the same speed with respect to light, the idea of being able to express the dynamic behavior of a system in the form of frozen geometric lines, the so-called phase portrait of a dynamic system, acquired a clear physical meaning.
Let's illustrate it on the example of a pendulum. The first experiments with a pendulum Jean Foucault conducted in 1851 in the cellar, then in the Paris Observatory, then under the dome of the Pantheon. Finally, in 1855, Foucault's pendulum was hung under the dome of the Saint-Martin-des-Champs church in Paris. The length of the rope of the Foucault pendulum is 67 m, the weight of the kettlebell is 28 kg. From a great distance, the pendulum looks like a point. The point is always stationary. Approaching, we distinguish a system with three typical trajectories: a harmonic oscillator (sinϕ ≈ ϕ), a pendulum (oscillations back and forth), a propeller (rotation).
Where a local observer sees one of three possible configurations of the ball's motion, an analyst detached from the process can assume that the ball makes one of three typical motions. This can be shown on one plane. It is necessary to agree that we will move the "ball on a thread" to an abstract phase space that has as many coordinates as the number of degrees of freedom the system under consideration has. In this case we are talking about two degrees of freedom speed v and the angle of inclination of the thread with the ball to the vertical ϕ. In the coordinates ϕ and v, the trajectory of the harmonic oscillator is a system of concentric circles; as the angle ϕ increases, these circles become oval, and when ϕ = ± π the closure of the oval is lost. This means that the pendulum has switched to propeller mode: v = const(Fig. 8).

Rice. 8. Pendulum: a) trajectory in the phase space of an ideal pendulum; b) the trajectory in the phase space of a pendulum swinging with damping; c) phase portrait
There may be no lengths, durations, or movements in the phase space. Here every action is pre-given, but not every action is real. From geometry, only topology remains, instead of measures, parameters, instead of dimensions, dimensions. Here, any dynamical system has its own unique imprint of the phase portrait. And among them there are rather strange phase portraits: being complex, they are determined by a single parameter; being commensurate, they are disproportionate; being continuous, they are discrete. Such strange phase portraits are characteristic of systems with a fractal configuration of attractors. The discreteness of the centers of attraction (attractors) creates the effect of a quantum of action, the effect of a gap or a jump, while the trajectories remain continuous and produce a single bound form of a strange attractor.
CLASSIFICATION OF FRACTALS. The fractal has three hypostases: formal, operational and symbolic, which are orthogonal to each other. And this means that the same form of a fractal can be obtained using different algorithms, and the same number of fractal dimensions can appear in completely different fractals. Taking into account these remarks, we classify fractals according to symbolic, formal and operational features:
- symbolically, the dimension characteristic of a fractal can be integer or fractional;
- on a formal basis, fractals can be connected, like a leaf or a cloud, and disconnected, like dust;
- On the operational basis, fractals can be divided into regular and stochastic.
Regular fractals are built according to a strictly defined algorithm. The construction process is reversible. You can repeat all the operations in reverse order, erasing any image created in the process of the deterministic algorithm, point by point. A deterministic algorithm can be linear or non-linear.
Stochastic fractals, similar in a stochastic sense, arise when in the algorithm for their construction, in the process of iterations, some parameters change randomly. The term "stochastic" comes from the Greek word stochasis- conjecture, conjecture. A stochastic process is a process whose nature of change cannot be accurately predicted. Fractals are produced by the whim of nature (fault surfaces rocks, clouds, turbulent flows, foam, gels, contours of soot particles, changes in stock prices and river levels, etc.), are devoid of geometric similarity, but stubbornly reproduce in each fragment the statistical properties of the whole on average. The computer allows you to generate sequences of pseudo-random numbers and immediately simulate stochastic algorithms and forms.
LINEAR FRACTALS. Linear fractals are named so for the reason that they are all built according to a certain linear algorithm. These fractals are self-similar, are not distorted by any change in scale, and are not differentiable at any of their points. To construct such fractals, it is sufficient to specify a base and a fragment. These elements will be repeated many times, zooming out to infinity.
Dust of Kantor. In the 19th century, the German mathematician Georg Ferdinand Ludwig Philipp Kantor (1845–1918) proposed to the mathematical community a strange set of numbers between 0 and 1. The set contained an infinite number of elements in the specified interval and, moreover, had zero dimension. An arrow fired at random would hardly have hit at least one element of this set.
First you need to choose a segment of unit length (first step: n = 0), then divide it into three parts and remove the middle third (n = 1). Further, we will do exactly the same with each of the formed segments. As a result of an infinite number of repetitions of the operation, we obtain the desired set of "Cantor's dust". Now there is no opposition between the discontinuous and the infinitely divisible. “Cantor's dust” is both (see Fig. 1). "Cantor Dust" is a fractal. Its fractal dimension is 0.6304…
One of the two-dimensional analogues of the one-dimensional Cantor set was described by the Polish mathematician Vaclav Sierpinski. It is called "cantor carpet" or more often "Sierpinski carpet". He is strictly self-similar. We can calculate its fractal dimension as ln8/lnЗ = 1.89… (Fig. 9).

LINES FILLING THE PLANE. Consider a whole family of regular fractals, which are curves capable of filling a plane. Leibniz also stated: “If we assume that someone puts many dots on paper by chance,<… >I say that it is possible to reveal a constant and complete, subject to a certain rule, a geometric line that will pass through all points. This statement by Leibniz contradicted Euclidean understanding of dimension as the smallest number of parameters by which the position of a point in space is uniquely determined. In the absence of a rigorous proof, these ideas of Leibniz remained on the periphery of mathematical thought.
Peano curve. But in 1890, the Italian mathematician Giuseppe Peano constructed a line that completely covers a flat surface, passing through all its points. The construction of the "Peano curve" is shown in fig. 10.

While the topological dimension of the Peano curve is equal to one, its fractal dimension is equal to d = ln(1/9)/ln(1/3) = 2. In the framework of fractal geometry, the paradox was resolved in the most natural way. A line, like a cobweb, can cover a plane. In this case, a one-to-one correspondence is established: each point of the line corresponds to a point on the plane. But this correspondence is not one-to-one, because each point on the plane corresponds to one or more points on the line.
Hilbert curve. A year later, in 1891, an article by the German mathematician David Hilbert (1862–1943) appeared in which he presented a curve covering a plane without intersections or tangency. The construction of the "Hilbert curve" is shown in fig. eleven.

The Hilbert curve was the first example of FASS curves (spaceFilling, selfAvoiding, Simple and selfSimilar space-filling self-avoiding, simple and self-similar lines). The fractal dimension of the Gilbert line, as well as the Peano curve, is equal to two.
Minkowski tape. Herman Minkowski, a close friend of Hilbert's from his student days, constructed a curve that does not cover the entire plane, but forms something like a ribbon. When constructing the "Minkowski tape" at each step, each segment is replaced by a broken line consisting of 8 segments. At the next stage, with each new segment, the operation is repeated on a scale of 1:4. The fractal dimension of the Minkowski strip is d = ln(l/8)/ln(1/4) = 1.5.

NONLINEAR FRACTALS. The simplest non-linear mapping of the complex plane onto itself is the Julia mapping z g z 2 + C considered in the first part. It is a closed loop calculation in which the result of the previous cycle is multiplied by itself with the addition of a certain constant to it, i.e. feedback loop (Fig. 13).

In the process of iterations for a fixed value of the constant C, depending on an arbitrary starting point Z 0 , the point Z n at n-> ∞ can be either finite or infinite. It all depends on the position of Z 0 relative to the origin z = 0. If the calculated value is finite, then it is included in the Julia set; if it goes to infinity, then it is cut off from the Julia set.
The form obtained after applying the Julia map to the points of some surface is uniquely determined by the parameter C. For small C, these are simple connected loops; for large C, these are clusters of disconnected but strictly ordered points. By and large, all Julia forms can be divided into two large families - connected and disconnected mappings. The former resemble "Koch's snowflake", the latter "Cantor's dust".
The diversity of Julia's shapes baffled mathematicians when they were first able to observe these shapes on computer monitors. Attempts to rank this variety were of a very arbitrary nature and came down to the fact that the basis for the classification of Julia maps was the Mandelbrot set, whose boundaries, as it turned out, are asymptotically similar to Julia maps.
With C = 0, the repetition of the Julia mapping gives a sequence of numbers z 0 , z 0 2 , z 0 4 , z 0 8 , z 0 16 ... As a result, three options are possible:
- for |z 0 |< 1 в процессе итераций числа z n по модулю будут уменьшаться, последовательно приближаясь к нулю. Иными словами, ноль есть точечный аттрактор;
- for |z 0 | > 1 in the course of iterations, the numbers z n increase in absolute value, tending to infinity. In this case, the attractor is a point at infinity, and we exclude such values from the Julia set;
- for |z 0 | = 1 all points of the sequence continue to remain on this unit circle. In this case, the attractor is a circle.
Thus, at C = 0, the boundary between the attractive and repulsive starting points is a circle. In this case, the mapping has two fixed points: z = 0 and z = 1. The first of them is attractive, since the derivative of the quadratic function at zero is 0, and the second is repulsive, since the derivative of the quadratic function at the value of the parameter one is equal to two.
Consider the situation when the constant C is a real number, i.e. we seem to be moving along the axis of the Mandelbrot set (Fig. 14). At C = –0.75, the boundary of the Julia set self-crosses and the second attractor appears. The fractal at this point bears the name of the San Marco fractal, given to it by Mandelbrot in honor of the famous Venetian cathedral. Looking at the figure, it is not difficult to understand why Mandelbrot came up with the idea to name the fractal in honor of this structure: the resemblance is amazing.

Rice. 14. Changing the form of the Julia set with a decrease in the real value of C from 0 to -1
Further reducing C to -1.25, we get a new standard form with four fixed points that persist up to C< 2. При С = 2 множество Жюлиа вырождается в отрезок, который тут же распадается в пыль, аналогичную «пыли Кантора» (рис. 15).

Rice. 15. The appearance of new forms of the Julia set with a decrease in the real value C< –1
So, even staying on the axis of the Mandelbrot fractal (constant C is a real number), we "captured" in the field of attention and in some way ranked a fairly large variety of Julia shapes from circle to dust. Now consider the sign areas of the Mandelbrot fractal and the corresponding forms of the Julia fractals. First of all, let's describe the Mandelbrot fractal in terms of "cardioid", "kidneys" and "onions" (Fig. 16).

The main cardioid and the circle adjacent to it form the basic shape of the Mandelbrot fractal. They are adjacent to an infinite number of its own copies, which are commonly called kidneys. Each of these buds is surrounded by an infinite number of smaller buds that look alike. The two largest buds above and below the main cardioid were called onions.
The Frenchman Adrien Dowdy and the American Bill Hubbard, who studied the typical fractal of this set (C = –0.12 + 0.74i), called it the “rabbit fractal” (Fig. 17).

When crossing the boundary of the Mandelbrot fractal, Julia fractals always lose their connection and turn into dust, which is usually called “Fatou dust” in honor of Pierre Fatou, who proved that for certain values of C, a point at infinity attracts the entire complex plane, except for a very thin set like dust ( Fig. 18).

STOCHASTIC FRACTALS. There is a significant difference between a strictly self-similar von Koch curve and, for example, the coast of Norway. The latter, not being strictly self-similar, exhibits similarity in a statistical sense. At the same time, both curves are broken so much that you cannot draw a tangent to any of their points, or, in other words, you cannot differentiate it. Such curves are kind of "monsters" among the normal Euclidean lines. The first to construct a continuous function that does not have a tangent at any of its points was Karl Theodor Wilhelm Weierstrass. His work was presented to the Royal Prussian Academy on 18 July 1872 and published in 1875. The functions described by Weierstrass look like noise (Fig. 19).

Look at a stock bulletin chart, a summary of temperature fluctuations or air pressure fluctuations, and you will find some regular irregularity. Moreover, when the scale is increased, the nature of the irregularity is preserved. And this refers us to fractal geometry.
Brownian motion is one of the most famous examples stochastic process. In 1926, Jean Perrin received the Nobel Prize for his study of the nature of Brownian motion. It was he who drew attention to the self-similarity and non-differentiability of the Brownian trajectory.
Fractals have been known for almost a century, are well studied and have numerous applications in life. This phenomenon is based on simple idea: an infinite number of figures in beauty and variety can be obtained from relatively simple structures with just two operations - copying and scaling
This concept does not have a strict definition. Therefore, the word "fractal" is not a mathematical term. This is usually the name of a geometric figure that satisfies one or more of the following properties:
- has a complex structure at any magnification;
- is (approximately) self-similar;
- has a fractional Hausdorff (fractal) dimension , which is larger than the topological one;
- can be built by recursive procedures.
At the turn of the 19th and 20th centuries, the study of fractals was more episodic than systematic, because earlier mathematicians mainly studied “good” objects that could be studied using general methods and theories. In 1872, the German mathematician Karl Weierstrass constructed an example of a continuous function that is nowhere differentiable. However, its construction was entirely abstract and difficult to understand. Therefore, in 1904, the Swede Helge von Koch came up with a continuous curve that has no tangent anywhere, and it is quite simple to draw it. It turned out that it has the properties of a fractal. One variation of this curve is called the Koch snowflake.
The ideas of self-similarity of figures were picked up by the Frenchman Paul Pierre Levy, the future mentor of Benoit Mandelbrot. In 1938, his article “Plane and Spatial Curves and Surfaces Consisting of Parts Similar to the Whole” was published, in which another fractal is described - the Lévy C-curve. All of the above fractals can be conditionally attributed to one class of constructive (geometric) fractals.
Another class is dynamic (algebraic) fractals, which include the Mandelbrot set. The first studies in this direction date back to the beginning of the 20th century and are associated with the names of the French mathematicians Gaston Julia and Pierre Fatou. In 1918, almost two hundred pages of Julia's work was published, devoted to iterations of complex rational functions, in which Julia sets are described - a whole family of fractals closely related to the Mandelbrot set. This work was awarded the prize of the French Academy, but it did not contain a single illustration, so it was impossible to appreciate the beauty of the discovered objects. Despite the fact that this work made Julia famous among the mathematicians of the time, it was quickly forgotten.
Only half a century later, with the advent of computers, attention turned to the work of Julia and Fatou: it was they who made the richness and beauty of the world of fractals visible. After all, Fatou could never look at the images that we now know as images of the Mandelbrot set, because the necessary number of calculations cannot be done manually. The first person to use a computer for this was Benoit Mandelbrot.
In 1982, Mandelbrot's book "The Fractal Geometry of Nature" was published, in which the author collected and systematized almost all the information about fractals available at that time and presented it in an easy and accessible manner. Mandelbrot made the main emphasis in his presentation not on ponderous formulas and mathematical constructions, but on the geometric intuition of readers. Thanks to computer generated illustrations and historical stories, with which the author skillfully diluted the scientific component of the monograph, the book became a bestseller, and the fractals became known to the general public. Their success among non-mathematicians is largely due to the fact that with the help of very simple constructions and formulas that even a high school student can understand, images of amazing complexity and beauty are obtained. When personal computers became powerful enough, even a whole trend in art appeared - fractal painting, and almost any computer owner could do it. Now on the Internet you can easily find many sites dedicated to this topic.
The concepts of fractal and fractal geometry, which appeared in the late 70s, have become firmly established in the everyday life of mathematicians and programmers since the mid-80s. The word fractal is derived from the Latin fractus and in translation means consisting of fragments. It was proposed by Benoit Mandelbrot in 1975 to refer to the irregular but self-similar structures that he studied. The birth of fractal geometry is usually associated with the publication of Mandelbrot's book `The Fractal Geometry of Nature' in 1977. His works used the scientific results of other scientists who worked in the period 1875-1925 in the same field (Poincaré, Fatou, Julia, Kantor, Hausdorff But only in our time it was possible to combine their works into a single system.
The role of fractals in computer graphics today is quite large. They come to the rescue, for example, when it is required, with the help of several coefficients, to set lines and surfaces very complex shape. From the point of view of computer graphics, fractal geometry is indispensable for the generation of artificial clouds, mountains, and the surface of the sea. actually found lung way representations of complex non-Euclidean objects, the images of which are very similar to natural ones.
One of the main properties of fractals is self-similarity. In the simplest case, a small part of the fractal contains information about the entire fractal. The definition of a fractal given by Mandelbrot is as follows: "A fractal is a structure consisting of parts that are in some sense similar to the whole."
Exist big number mathematical objects called fractals (the Sierpinski triangle, the Koch snowflake, the Peano curve, the Mandelbrot set, and the Lorentz attractors). Fractals describe with great accuracy many physical phenomena and formations of the real world: mountains, clouds, turbulent (vortex) currents, roots, branches and leaves of trees, blood vessels, which is far from corresponding to simple geometric shapes. For the first time, Benoit Mandelbrot spoke about the fractal nature of our world in his seminal work "The Fractal Geometry of Nature".
The term fractal was introduced by Benoit Mandelbrot in 1977 in his fundamental work "Fractals, Form, Chaos and Dimension". According to Mandelbrot, the word fractal comes from the Latin words fractus - fractional and frangere - to break, which reflects the essence of the fractal as a "broken", irregular set.
Classification of fractals.
In order to represent the whole variety of fractals, it is convenient to resort to their generally accepted classification. There are three classes of fractals.
1. Geometric fractals.
Fractals of this class are the most obvious. In the two-dimensional case, they are obtained using a broken line (or surface in three-dimensional case) called a generator. In one step of the algorithm, each of the segments that make up the broken line is replaced by a broken line generator in the appropriate scale. As a result of the endless repetition of this procedure, a geometric fractal is obtained.
Consider, for example, one of such fractal objects - the Koch triadic curve.
Construction of the triadic Koch curve.
Take a straight line segment of length 1. Let's call it seed. Let us divide the seed into three equal parts of length 1/3, discard the middle part and replace it with a broken line of two links of length 1/3.
We get a broken line, consisting of 4 links with a total length of 4/3, - the so-called first generation.
In order to move on to the next generation of the Koch curve, it is necessary to discard and replace the middle part of each link. Accordingly, the length of the second generation will be 16/9, the third - 64/27. if you continue this process to infinity, then the result will be a triadic Koch curve.
Let us now consider the holy triadic Koch curve and find out why fractals were called "monsters".
First, this curve has no length - as we have seen, with the number of generations, its length tends to infinity.
Secondly, it is impossible to construct a tangent to this curve - each of its points is an inflection point at which the derivative does not exist - this curve is not smooth.
Length and smoothness are the fundamental properties of curves, which are studied both by Euclidean geometry and by the geometry of Lobachevsky and Riemann. The traditional methods of geometric analysis turned out to be inapplicable to the triadic Koch curve, so the Koch curve turned out to be a monster - a "monster" among the smooth inhabitants of traditional geometries.
Construction of the "dragon" Harter-Hateway.

To obtain another fractal object, you need to change the construction rules. Let the generating element be two equal segments connected at right angles. In the zero generation, we replace the unit segment with this generating element so that the angle is on top. We can say that with such a replacement, a shift in the middle of the link occurs. When constructing the next generations, the rule is fulfilled: the very first link on the left is replaced by a generating element so that the middle of the link is shifted to the left of the direction of movement, and when replacing the next links, the directions of displacement of the midpoints of the segments must alternate. The figure shows the first few generations and the 11th generation of the curve built according to the principle described above. The curve with n tending to infinity is called the Harter-Hateway dragon.
In computer graphics, the use of geometric fractals is necessary when obtaining images of trees and bushes. Two-dimensional geometric fractals are used to create three-dimensional textures (patterns on the surface of an object).
2. Algebraic fractals
This is the largest group of fractals. They are obtained using non-linear processes in n-dimensional spaces. Two-dimensional processes are the most studied. Interpreting a nonlinear iterative process as a discrete dynamical system, one can use the terminology of the theory of these systems: phase portrait, steady state process, attractor, etc.
It is known that nonlinear dynamical systems have several stable states. The state in which the dynamical system finds itself after a certain number of iterations depends on its initial state. Therefore, each stable state (or, as they say, an attractor) has a certain area of initial states, from which the system will necessarily fall into the considered final states. Thus, the phase space of the system is divided into areas of attraction of attractors. If the phase space is two-dimensional, then by coloring the attraction regions with different colors, one can obtain a color phase portrait of this system (iterative process). By changing the color selection algorithm, you can get complex fractal patterns with fancy multicolor patterns. A surprise for mathematicians was the ability to generate very complex non-trivial structures using primitive algorithms.
The Mandelbrot set. 
As an example, consider the Mandelbrot set. The algorithm for its construction is quite simple and is based on a simple iterative expression: Z = Z[i] * Z[i] + C, where Zi and C are complex variables. Iterations are performed for each starting point from a rectangular or square region - a subset of the complex plane. The iterative process continues until Z[i] will not go beyond the circle of radius 2, the center of which lies at the point (0,0), (this means that the attractor of the dynamical system is at infinity), or after a sufficiently large number of iterations (for example, 200-500) Z[i] converges to some point on the circle. Depending on the number of iterations during which Z[i] remained inside the circle, you can set the color of the point C(if Z[i] remains inside the circle for a sufficiently large number of iterations, the iteration process stops and this raster point is painted black).
3. Stochastic fractals
Another well-known class of fractals are stochastic fractals, which are obtained if any of its parameters are randomly changed in an iterative process. This results in objects very similar to natural ones - asymmetrical trees, indented coastlines, etc. Two-dimensional stochastic fractals are used in modeling the terrain and sea surface.
There are other classifications of fractals, for example, the division of fractals into deterministic (algebraic and geometric) and non-deterministic (stochastic).
About the use of fractals
First of all, fractals are an area of amazing mathematical art, when with the help of the simplest formulas and algorithms, pictures of extraordinary beauty and complexity are obtained! In the contours of the constructed images, leaves, trees and flowers are often guessed.
One of the most powerful applications of fractals lies in computer graphics. Firstly, it is fractal compression of images, and secondly, the construction of landscapes, trees, plants and the generation of fractal textures. Modern physics and mechanics are just beginning to study the behavior of fractal objects. And, of course, fractals are applied directly in mathematics itself.
The advantages of fractal image compression algorithms are very small size packed file and short image recovery time. Fractally packed pictures can be scaled without the appearance of pixelation. But the compression process takes a long time and sometimes lasts for hours. The lossy fractal packing algorithm allows you to set the compression level, similar to the jpeg format. The algorithm is based on the search for large pieces of the image similar to some small pieces. And only which piece is similar to which is written to the output file. When compressing, a square grid is usually used (pieces are squares), which leads to a slight angularity when restoring the picture, a hexagonal grid is free from such a drawback.
Iterated has developed a new image format, "Sting", which combines fractal and "wave" (such as jpeg) lossless compression. The new format allows you to create images with the possibility of subsequent high-quality scaling, and the volume of graphic files is 15-20% of the volume of uncompressed images.
The tendency of fractals to look like mountains, flowers and trees is exploited by some graphic editors, for example, fractal clouds from 3D studio MAX, fractal mountains in World Builder. Fractal trees, mountains and whole landscapes are given by simple formulas, are easy to program and do not fall apart into separate triangles and cubes when approached.
You can not ignore the use of fractals in mathematics itself. In set theory, the Cantor set proves the existence of perfect nowhere dense sets; in measure theory, the self-affine function "Cantor's ladder" is good example singular measure distribution functions.
In mechanics and physics, fractals are used due to unique property repeat the outlines of many objects of nature. Fractals allow you to approximate trees, mountain surfaces, and fissures with higher accuracy than approximations with line segments or polygons (with the same amount of stored data). fractal patterns, like natural objects, have "roughness", and this property is preserved at an arbitrarily large increase in the model. The presence of a uniform measure on fractals makes it possible to apply integration, potential theory, to use them instead of standard objects in the equations already studied.
With the fractal approach, chaos ceases to be blue disorder and acquires a fine structure. Fractal science is still very young and has a great future ahead of it. The beauty of fractals is far from being exhausted and will still give us many masterpieces - those that delight the eye, and those that bring true pleasure to the mind.
About building fractals
Method of successive approximations

Looking at this picture, it is not difficult to understand how a self-similar fractal (in this case, the Sierpinski pyramid) can be built. We need to take an ordinary pyramid (tetrahedron), then cut out its middle (octahedron), as a result of which we get four small pyramids. With each of them we perform the same operation, and so on. This is a somewhat naive, but illustrative explanation.
Let us consider the essence of the method more strictly. Let there be some IFS system, i.e. contraction mapping system S=(S 1 ,...,S m ) S i:R n ->R n (for example, for our pyramid, the mappings look like S i (x)=1/2*x+o i , where o i are the vertices of the tetrahedron, i=1,..,4). Then we choose some compact set A 1 in R n (in our case we choose a tetrahedron). And we determine by induction the sequence of sets A k:A k+1 =S 1 (A k) U...U S m (A k). It is known that the sets A k with increasing k approximate the required attractor of the system S.
Note that each of these iterations is an attractor recurrent system of iterated functions (English term DigraphIFS, RIFS and also Graph-directed IFS) and therefore they are easy to build with our program.
Construction by points or probabilistic method
This is the easiest method to implement on a computer. For simplicity, consider the case of a flat self-affine set. So let (S
) is some system of affine contractions. Mappings S
representable as: S
Fixed matrix of size 2x2 and o
Two-dimensional vector column.
- Let's take a fixed point of the first mapping S 1 as a starting point:
x:=o1;
Here we use the fact that all fixed contraction points S 1 ,..,S m belong to the fractal. As a starting point, you can choose arbitrary point and the sequence of points generated by it will shrink to a fractal, but then a few extra points will appear on the screen. - Note the current point x=(x 1 ,x 2) on the screen:
putpixel(x 1 ,x 2 ,15); - We randomly choose a number j from 1 to m and recalculate the coordinates of the point x:
j:=Random(m)+1;
x:=S j (x); - We go to step 2, or, if we have done a sufficiently large number of iterations, then we stop.
Note. If the coefficients of compression of the mappings S i are different, then the fractal will be filled with points unevenly. If the mappings S i are similarities, this can be avoided by slightly complicating the algorithm. To do this, at the 3rd step of the algorithm, the number j from 1 to m must be chosen with the probabilities p 1 =r 1 s ,..,p m =r m s , where r i denote the contraction coefficients of the mappings S i , and the number s (called the similarity dimension) is found from the equation r 1 s +...+r m s =1. The solution of this equation can be found, for example, by Newton's method.
About fractals and their algorithms
The fractal comes from Latin adjective"fractus", and in translation means consisting of fragments, and the corresponding Latin verb "frangere" means to break, that is, to create irregular fragments. The concepts of fractal and fractal geometry, which appeared in the late 70s, have become firmly established in the everyday life of mathematicians and programmers since the mid-80s. The term was proposed by Benoit Mandelbrot in 1975 to refer to the irregular but self-similar structures that he studied. The birth of fractal geometry is usually associated with the publication in 1977 of Mandelbrot's book "The Fractal Geometry of Nature" - "The Fractal Geometry of Nature". His works used the scientific results of other scientists who worked in the period 1875-1925 in the same field (Poincaré, Fatou, Julia, Kantor, Hausdorff).
Adjustments
Let me make some adjustments to the algorithms proposed in the book by H.-O. Paytgen and P.H. Richter "The Beauty of Fractals" M. 1993, purely to eradicate typos and make it easier to understand the processes, since after studying them, much remained a mystery to me. Unfortunately, these "understandable" and "simple" algorithms lead a rocking lifestyle.
The construction of fractals is based on a certain nonlinear function of a complex process with feedback z \u003d z 2 + c since z and c are complex numbers, then z \u003d x + iy, c \u003d p + iq, it is necessary to decompose it into x and y in order to go to more realistic for common man plane:
x(k+1)=x(k) 2 -y(k) 2 + p,
y(k+1)=2*x(k)*y(k) + q.
The plane consisting of all pairs (x, y) can be considered as with fixed values p and q, as well as for dynamic ones. In the first case, sorting through all the points (x, y) of the plane according to the law and coloring them depending on the number of repetitions of the function necessary to exit the iterative process or not coloring (black) when the allowable maximum of repetitions is increased, we get the display of the Julia set. If, on the contrary, we determine the initial pair of values (x, y) and trace its coloristic fate with dynamically changing values of the parameters p and q, then we get images called Mandelbrot sets.
On the question of fractal coloring algorithms.
Usually the body of the set is represented as a black field, although it is obvious that the black color can be replaced by any other, but this is also an uninteresting result. To get an image of a set painted in all colors is a task that cannot be solved using cyclic operations, since the number of iterations forming the body of the set is equal to the maximum possible and always the same. Color the set in different colors perhaps by using the result of checking the exit condition from the loop (z_magnitude) as the color number, or similar to it, but with other mathematical operations.
Application of the "fractal microscope"
to demonstrate frontier phenomena.
Attractors are the centers leading the struggle for dominance on the plane. Between the attractors there is a border representing a swirling pattern. By increasing the scale of consideration within the boundaries of the set, one can obtain non-trivial patterns reflecting the state of deterministic chaos - commonplace in the natural world.
The objects studied by geographers form a system with very complexly organized boundaries, in connection with which their implementation becomes a difficult practical task. Natural complexes have cores of typicality acting as attractors that lose their power of influence on the territory as it moves away.
Using a fractal microscope for the Mandelbrot and Julia sets, one can form an idea of boundary processes and phenomena that are equally complex regardless of the scale of consideration and thus prepare the perception of a specialist for a meeting with a dynamic and seemingly chaotic in space and time natural object, for understanding fractal geometry nature. Multicolored colors and fractal music will definitely leave a deep mark on the minds of students.
Thousands of publications and huge Internet resources are devoted to fractals, however, for many specialists far from computer science, this term seems completely new. Fractals, as objects of interest to specialists in various fields of knowledge, should receive their proper place in the course of computer science.
Examples
| SIERPINSKI GRID |
 This is one of the fractals that Mandelbrot experimented with when developing the concepts of fractal dimensions and iterations. Triangles formed by joining the midpoints of the larger triangle are cut from the main triangle to form a triangle, with more holes. In this case, the initiator is a large triangle and the template is an operation to cut triangles similar to the larger one. You can also get a 3D version of a triangle by using an ordinary tetrahedron and cutting out smaller tetrahedra. The dimension of such a fractal is ln3/ln2 = 1.584962501. To obtain Sierpinski carpet, take a square, divide it into nine squares, and cut out the middle one. We will do the same with the rest, smaller squares. In the end, a flat fractal grid is formed, which has no area, but with infinite connections. In its spatial form, the Sierpinski sponge is transformed into a system of through forms, in which each through element is constantly replaced by its own kind. This structure is very similar to a section of bone tissue. Someday such repeating structures will become an element of building structures. Their statics and dynamics, Mandelbrot believes, deserve close study. |

| KOCH CURVE |
 The Koch curve is one of the most typical deterministic fractals. It was invented in the nineteenth century by a German mathematician named Helge von Koch, who, while studying the work of Georg Kontor and Karl Weierstraße, came across descriptions of some strange curves with unusual behavior. Initiator - direct line. The generator is an equilateral triangle, the sides of which are equal to a third of the length of the larger segment. These triangles are added to the middle of each segment over and over again. In his research, Mandelbrot experimented a lot with Koch curves, and obtained figures such as Koch Islands, Koch Crosses, Koch Snowflakes, and even three-dimensional representations of the Koch curve by using a tetrahedron and adding smaller tetrahedra to each of its faces. The Koch curve has dimension ln4/ln3 = 1.261859507. |
| Fractal Mandelbrot |
 This is NOT the Mandelbrot set that you see quite often. The Mandelbrot set is based on nonlinear equations and is a complex fractal. This is also a variant of the Koch curve, despite the fact that this object does not look like it. The initiator and generator are also different from those used to create fractals based on the principle of the Koch curve, but the idea remains the same. Instead of attaching equilateral triangles to a curve segment, squares are attached to a square. Due to the fact that this fractal occupies exactly half of the allotted space at each iteration, it has a simple fractal dimension of 3/2 = 1.5. |
| DARER'S PENTAGON |
|
A fractal looks like a bunch of pentagons squeezed together. In fact, it is formed by using a pentagon as an initiator and isosceles triangles, the ratio of the larger side to the smaller one in which is exactly equal to the so-called golden ratio (1.618033989 or 1/(2cos72)) as a generator. These triangles are cut from the middle of each pentagon, resulting in a shape that looks like 5 small pentagons glued to one large one. A variant of this fractal can be obtained by using a hexagon as the initiator. This fractal is called the Star of David and is quite similar to the hexagonal version of Koch's Snowflake. The fractal dimension of the Darer pentagon is ln6/ln(1+g), where g is the ratio of the length of the larger side of the triangle to the length of the smaller side. In this case, g is the Golden Ratio, so the fractal dimension is approximately 1.86171596. The fractal dimension of the Star of David is ln6/ln3 or 1.630929754. |

Complex fractals
In fact, if you zoom in on a small area of any complex fractal and then do the same on a small area of that area, the two magnifications will be significantly different from each other. The two images will be very similar in detail, but they won't be completely identical.  Fig 1. Approximation of the Mandelbrot set
Compare, for example, the pictures of the Mandelbrot set shown here, one of which was obtained by increasing some area of the other. As you can see, they are absolutely not identical, although on both we see a black circle, from which flaming tentacles go in different directions. These elements repeat indefinitely in the Mandelbrot set in decreasing proportion.
Deterministic fractals are linear, while complex fractals are not. Being non-linear, these fractals are generated by what Mandelbrot called non-linear algebraic equations. A good example is the process Zn+1=ZnІ + C, which is the equation used to construct the Mandelbrot and Julia sets of the second degree. Solving these mathematical equations involves complex and imaginary numbers. When the equation is interpreted graphically in the complex plane, the result is a strange figure in which straight lines turn into curves, self-similarity effects appear at various scale levels, although not without deformations. At the same time, the whole picture as a whole is unpredictable and very chaotic.
As you can see by looking at the pictures, complex fractals are indeed very complex and impossible to create without the help of a computer. To get colorful results, this computer must have a powerful math coprocessor and a monitor with high resolution. Unlike deterministic fractals, complex fractals are not calculated in 5-10 iterations. Almost every dot on the computer screen is like a separate fractal. During mathematical processing, each point is treated as a separate figure. Each point corresponds to a certain value. The equation is built in for each point and is performed, for example, 1000 iterations. To obtain a relatively undistorted image in a time interval acceptable for home computers, it is possible to carry out 250 iterations for one point.
Most of the fractals we see today are beautifully colored. Perhaps fractal images have gained such great aesthetic value precisely because of their color schemes. After the equation is calculated, the computer analyzes the results. If the results remain stable, or fluctuate around a certain value, the dot will usually turn black. If the value at one step or another tends to infinity, the point is painted in a different color, maybe blue or red. During this process, the computer assigns colors to all movement speeds.
Usually, fast moving dots are painted red, while slower ones are yellow, and so on. Dark dots are probably the most stable.
Complex fractals differ from deterministic fractals in that they are infinitely complex, yet can be generated by a very simple formula. Deterministic fractals don't need formulas or equations. Just take some drawing paper and you can build a Sierpinski sieve up to 3 or 4 iterations without any difficulty. Try to do it with lots of Julia! It's easier to go measure the length of the coastline of England!
MANDERBROT SET
 Fig 2. Mandelbrot set
The Mandelbrot and Julia sets are probably the two most common among complex fractals. They can be found in many scientific journals, book covers, postcards, and computer screen savers. The Mandelbrot set, which was built by Benoit Mandelbrot, is probably the first association that people have when they hear the word fractal. This fractal, resembling a card with glowing tree and circle areas attached to it, is generated by the simple formula Zn+1=Zna+C, where Z and C are complex numbers and a is a positive number.
The most commonly seen Mandelbrot set is the 2nd degree Mandelbrot set, i.e. a=2. The fact that the Mandelbrot set is not only Zn+1=ZnІ+C, but a fractal whose exponent in the formula can be any positive number misled many people. On this page you see an example of a Mandelbrot set for different meanings indicator a. 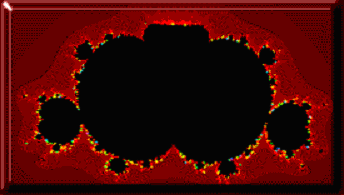
Figure 3. The appearance of bubbles at a=3.5
The process Z=Z*tg(Z+C) is also popular. Thanks to the inclusion of the tangent function, the Mandelbrot set is obtained, surrounded by an area resembling an apple. When using the cosine function, air bubble effects are obtained. In short, there are an infinite number of ways to tweak the Mandelbrot set to produce various beautiful pictures.
MULTIPLE JULIA
Surprisingly, the Julia sets are formed according to the same formula as the Mandelbrot set. The Julia set was invented by the French mathematician Gaston Julia, after whom the set was named. The first question that arises after a visual acquaintance with the Mandelbrot and Julia sets is "if both fractals are generated by the same formula, why are they so different?" First look at the pictures of the Julia set. Strange enough, but there are different types Julia sets. When drawing a fractal using different starting points (to start the iteration process), various images. This only applies to the Julia set. 
Fig 4. Julia set
Although it can't be seen in the picture, a Mandelbrot fractal is actually a bunch of Julia fractals connected together. Each point (or coordinate) of the Mandelbrot set corresponds to a Julia fractal. Julia sets can be generated using these points as initial values in the equation Z=ZI+C. But this does not mean that if you select a point on the Mandelbrot fractal and increase it, you can get a Julia fractal. These two points are identical, but only in a mathematical sense. If we take this point and calculate it according to this formula, we can get the Julia fractal corresponding to certain point fractal Mandelbrot.
Municipal budgetary educational institution
"Siverskaya secondary school No. 3"
Research
mathematics.
Did the job
8th grade student
Emelin Pavel
scientific adviser
mathematic teacher
Tupitsyna Natalya Alekseevna
p. Siversky
year 2014
Mathematics is all permeated with beauty and harmony,
You just have to see this beauty.
B. Mandelbrot
Introduction
Chapter 1. The history of the emergence of fractals. _______ 5-6 pp.
Chapter 2. Classification of fractals.____________________6-10pp.
geometric fractals
Algebraic fractals
Stochastic fractals
Chapter 3. "Fractal geometry of nature" ______ 11-13pp.
Chapter 4. Application of fractals _______________13-15pp.
Chapter 5 Practical work __________________ 16-24pp.
Conclusion_________________________________25.page
List of literature and Internet resources _______ 26 p.
Introduction
Maths,
if you look at it right,
reflects not only the truth,
but also incomparable beauty.
Bertrand Russell
 The word "fractal" is something that a lot of people are talking about these days, from scientists to students. high school. It appears on the covers of many math textbooks, scientific journals, and computer boxes. software. Color images of fractals today can be found everywhere: from postcards, T-shirts to pictures on the desktop of a personal computer. So, what are these colored shapes that we see around?
Mathematics is the oldest science. Most people thought that the geometry in nature is limited to such simple figures like line, circle, polygon, sphere, etc. As it turns out, many natural systems are so complex that using only familiar objects of ordinary geometry to model them seems hopeless. How, for example, to build a model mountain range or crowns of a tree in terms of geometry? How to describe the diversity of biological diversity that we observe in the world of plants and animals? How to imagine the whole complexity of the circulatory system, consisting of many capillaries and vessels and delivering blood to every cell of the human body? Imagine the structure of the lungs and kidneys, resembling trees with a branchy crown in structure?
Fractals are a suitable means for exploring the questions posed. Often what we see in nature intrigues us with the endless repetition of the same pattern, enlarged or reduced by several times. For example, a tree has branches. These branches have smaller branches, and so on. Theoretically, the "fork" element repeats infinitely many times, getting smaller and smaller. The same can be seen when looking at the photo. mountainous terrain. Try zooming in a bit on the mountain range --- you will see the mountains again. This is how the property of self-similarity characteristic of fractals manifests itself.
The study of fractals opens up wonderful possibilities, both in the study of an infinite number of applications, and in the field of mathematics. The use of fractals is very extensive! After all, these objects are so beautiful that they are used by designers, artists, with the help of them many elements of trees, clouds, mountains, etc. are drawn in graphics. But fractals are even used as antennas in many cell phones.
For many chaologists (scientists who study fractals and chaos), this is not just a new field of knowledge that combines mathematics, theoretical physics, art and computer technology - this is a revolution. This is the discovery of a new type of geometry, the geometry that describes the world around us and which can be seen not only in textbooks, but also in nature and everywhere in the boundless universe..
In my work, I also decided to “touch” the world of beauty and determined for myself…
purpose of work: creating objects that are very similar to nature.
Research methods Keywords: comparative analysis, synthesis, modeling.
Tasks:
acquaintance with the concept, history of occurrence and research of B. Mandelbrot,
G. Koch, V. Sierpinsky and others;
familiarity with various types of fractal sets;
study of popular science literature on this issue, acquaintance with
scientific hypotheses;
finding confirmation of the theory of fractality of the surrounding world;
study of the use of fractals in other sciences and in practice;
conducting an experiment to create your own fractal images.
Core question of the job:
Show that mathematics is not a dry, soulless subject, it can express spiritual world individual and in society as a whole.
Subject of study: Fractal geometry.
Object of study: fractals in mathematics and in the real world.
Hypothesis: Everything that exists in the real world is a fractal.
Research methods: analytical, search.
Relevance of the declared topic is determined, first of all, by the subject of research, which is fractal geometry.
Expected results: In the course of work, I will be able to expand my knowledge in the field of mathematics, see the beauty of fractal geometry, and start working on creating my own fractals.
The result of the work will be the creation computer presentation, newsletter and booklet.
Chapter 1
B  Enua Mandelbrot
The term "fractal" was coined by Benoit Mandelbrot. The word comes from the Latin "fractus", meaning "broken, shattered".
Fractal (lat. fractus - crushed, broken, broken) - a term meaning a complex geometric figure with the property of self-similarity, that is, composed of several parts, each of which is similar to the entire figure as a whole.
The mathematical objects to which it refers are characterized by extremely interesting properties. In ordinary geometry, a line has one dimension, a surface has two dimensions, and a spatial figure is three-dimensional. Fractals, on the other hand, are not lines or surfaces, but, if you can imagine it, something in between. With an increase in size, the volume of the fractal also increases, but its dimension (exponent) is not an integer, but a fractional value, and therefore the border of the fractal figure is not a line: at high magnification, it becomes clear that it is blurred and consists of spirals and curls, repeating in small the scale of the figure itself. Such geometric regularity is called scale invariance or self-similarity. It is she who determines the fractional dimension of fractal figures.
Before the advent of fractal geometry, science dealt with systems contained in three spatial dimensions. Thanks to Einstein, it became clear that three-dimensional space- only a model of reality, not reality itself. In fact, our world is located in a four-dimensional space-time continuum.
Thanks to Mandelbrot, it became clear what a four-dimensional space looks like, figuratively speaking, the fractal face of Chaos. Benoit Mandelbrot discovered that the fourth dimension includes not only the first three dimensions, but also (this is very important!) the intervals between them.
Recursive (or fractal) geometry is replacing Euclidean. new science able to describe true nature bodies and phenomena. Euclidean geometry dealt only with artificial, imaginary objects belonging to three dimensions. Only the fourth dimension can turn them into reality.
Liquid, gas, solid are the three usual physical states of matter that exists in the three-dimensional world. But what is the dimension of the puff of smoke, clouds, or rather, their boundaries, continuously blurred by turbulent air movement?
Basically, fractals are classified into three groups:
Algebraic fractals
Stochastic fractals
geometric fractals
Let's take a closer look at each of them.
Chapter 2. Classification of fractals
geometric fractals
Benoit Mandelbrot proposed the fractal model, which has already become a classic and is often used to demonstrate how typical example the fractal itself, and to demonstrate the beauty of fractals, which also attracts researchers, artists, and people who are simply interested.
It was with them that the history of fractals began. This type of fractals is obtained by simple geometric constructions. Usually, when constructing these fractals, one proceeds as follows: a "seed" is taken - an axiom - a set of segments, on the basis of which the fractal will be built. Further, a set of rules is applied to this "seed", which transforms it into some geometric figure. Further, the same set of rules is again applied to each part of this figure. With each step, the figure will become more and more complex, and if we carry out (at least in the mind) an infinite number of transformations, we will get a geometric fractal.
Fractals of this class are the most visual, because they are immediately visible self-similarity at any scale of observation. In the two-dimensional case, such fractals can be obtained by specifying some broken line, called a generator. In one step of the algorithm, each of the segments that make up the broken line is replaced by a broken line-generator, in the appropriate scale. As a result of the endless repetition of this procedure (or, more precisely, when passing to the limit), a fractal curve is obtained. With the apparent complexity of the resulting curve, its general form is given only by the form of the generator. Examples of such curves are: Koch curve (Fig.7), Peano curve (Fig.8), Minkowski curve.
At the beginning of the 20th century, mathematicians were looking for curves that did not have a tangent at any point. This meant that the curve abruptly changed its direction, and, moreover, at an enormously high speed (the derivative is equal to infinity). The search for these curves was caused not just by the idle interest of mathematicians. The fact is that at the beginning of the twentieth century, a very rapidly developing quantum mechanics. Researcher M. Brown sketched the trajectory of suspended particles in water and explained this phenomenon as follows: randomly moving liquid atoms hit suspended particles and thereby set them in motion. After such an explanation of Brownian motion, scientists were faced with the task of finding a curve that would best show the motion of Brownian particles. For this, the curve had to correspond the following properties: not have a tangent at any point. The mathematician Koch proposed one such curve.
To  the Koch curve is a typical geometric fractal. The process of its construction is as follows: we take a single segment, divide it into three equal parts and replace the middle interval with an equilateral triangle without this segment. As a result, a broken line is formed, consisting of four links of length 1/3. At the next step, we repeat the operation for each of the four resulting links, and so on ...
The limit curve is Koch curve.

Snowflake Koch. By performing a similar transformation on the sides of an equilateral triangle, you can get a fractal image of a Koch snowflake.
T  Another simple representative of a geometric fractal is Sierpinski square. It is built quite simply: The square is divided by straight lines parallel to its sides into 9 equal squares. The central square is removed from the square. It turns out a set consisting of 8 remaining squares of the "first rank". Doing the same with each of the squares of the first rank, we get a set consisting of 64 squares of the second rank. Continuing this process indefinitely, we obtain an infinite sequence or Sierpinski square.
Algebraic fractals
This is the largest group of fractals. Algebraic fractals got their name because they are built using simple algebraic formulas.
They are obtained using non-linear processes in n-dimensional spaces. It is known that nonlinear dynamical systems have several stable states. The state in which the dynamical system finds itself after a certain number of iterations depends on its initial state. Therefore, each stable state (or, as they say, an attractor) has a certain area of initial states, from which the system will necessarily fall into the considered final states. Thus, the phase space of the system is divided into areas of attraction attractors. If the phase space is two-dimensional, then by coloring the attraction regions with different colors, one can obtain color phase portrait this system (iterative process). By changing the color selection algorithm, you can get complex fractal patterns with fancy multicolor patterns. A surprise for mathematicians was the ability to generate very complex structures using primitive algorithms.


As an example, consider the Mandelbrot set. It is built using complex numbers.

Part of the boundary of the Mandelbrot set, magnified 200 times.
The Mandelbrot set contains points that duringendless the number of iterations does not go to infinity (points that are black). Points belonging to the boundary of the set(this is where complex structures arise) go to infinity in a finite number of iterations, and points lying outside the set go to infinity after several iterations (white background).
P 
 An example of another algebraic fractal is the Julia set. There are 2 varieties of this fractal. Surprisingly, the Julia sets are formed according to the same formula as the Mandelbrot set. The Julia set was invented by the French mathematician Gaston Julia, after whom the set was named.
And  interesting fact, some algebraic fractals strikingly reminiscent of images of animals, plants and other biological objects, as a result of which they received the name biomorphs.
Stochastic fractals
Another well-known class of fractals are stochastic fractals, which are obtained if any of its parameters are randomly changed in an iterative process. This results in objects very similar to natural ones - asymmetrical trees, indented coastlines, etc.
A typical representative of this group of fractals is "plasma".
D  To construct it, a rectangle is taken and a color is determined for each of its corners. Next, the central point of the rectangle is found and painted in a color equal to the arithmetic mean of the colors at the corners of the rectangle plus some random number. The larger the random number, the more "torn" the picture will be. If we assume that the color of the point is the height above sea level, we will get a mountain range instead of plasma. It is on this principle that mountains are modeled in most programs. Using a plasma-like algorithm, a height map is built, various filters are applied to it, a texture is applied, and photorealistic mountains are ready.
E  If we look at this fractal in a section, then we will see this fractal is voluminous, and has a “roughness”, just because of this “roughness” there is a very important application of this fractal.
Let's say you want to describe the shape of a mountain. Ordinary figures from Euclidean geometry will not help here, because they do not take into account the surface topography. But when combining conventional geometry with fractal geometry, you can get the very “roughness” of the mountain. Plasma must be applied to an ordinary cone and we will get the relief of the mountain. Such operations can be performed with many other objects in nature, thanks to stochastic fractals, nature itself can be described.
Now let's talk about geometric fractals.
.
Chapter 3 "The Fractal Geometry of Nature"
Why is geometry often referred to as "cold" and "dry"? One reason is its inability to describe the shape of a cloud, mountain, coastline or tree. Clouds are not spheres, mountains are not cones, coastlines are not circles, tree bark is not smooth, lightning does not travel in a straight line. general plan I contend that many objects in Nature are so irregular and fragmented that compared to Euclid - a term which in this work means all standard geometry - Nature has not just more complexity, but a complexity of an entirely different level. Number different scales the length of natural objects for all practical purposes is infinite".
(Benoit Mandelbrot "The Fractal Geometry of Nature" ).
To  The beauty of fractals is twofold: it delights the eye, as evidenced by at least the world-wide exhibition of fractal images, organized by a group of Bremen mathematicians under the leadership of Peitgen and Richter. Later, the exhibits of this grandiose exhibition were captured in illustrations for the book "The Beauty of Fractals" by the same authors. But there is another, more abstract or sublime, aspect of the beauty of fractals, open, according to R. Feynman, only to the mental gaze of the theorist, in this sense, fractals are beautiful with the beauty of a difficult mathematical problem. Benoit Mandelbrot pointed out to his contemporaries (and, presumably, to his descendants) an unfortunate gap in Euclid's Elements, according to which, not noticing the omission, for almost two millennia mankind comprehended the geometry of the surrounding world and learned the mathematical rigor of presentation. Of course, both aspects of the beauty of fractals are closely interconnected and do not exclude, but mutually complement each other, although each of them is self-sufficient.
The fractal geometry of nature, according to Mandelbrot, is a real geometry that satisfies the definition of geometry proposed in F. Klein's "Erlangen Program". The fact is that before the advent of non-Euclidean geometry, N.I. Lobachevsky - L. Bolyai, there was only one geometry - the one that was set out in the "Beginnings", and the question of what geometry is and which of the geometries is the geometry of the real world did not arise, and could not arise. But with the advent of yet another geometry, the question arose of what geometry is in general, and which of the many geometries corresponds to the real world. According to F. Klein, geometry studies such properties of objects that are invariant under transformations: Euclidean - invariants of the group of motions (transformations that do not change the distance between any two points, i.e. representing a superposition of parallel translations and rotations with or without a change in orientation) , Lobachevsky-Bolyai geometry - invariants of the Lorentz group. Fractal geometry deals with the study of invariants of the group of self-affine transformations, i.e. properties expressed by power laws.
As for the correspondence to the real world, fractal geometry describes a very wide class of natural processes and phenomena, and therefore we can, following B. Mandelbrot, rightfully speak about the fractal geometry of nature. New - fractal objects have unusual properties. The lengths, areas and volumes of some fractals are equal to zero, others turn to infinity.
Nature often creates amazing and beautiful fractals, with perfect geometry and such harmony that you simply freeze with admiration. And here are their examples:


sea shells

Lightning admiring their beauty. The fractals created by lightning are not random or regular.

fractal shape subspecies of cauliflower(Brassica cauliflora). This special kind is a particularly symmetrical fractal.
P  fern is also a good example of a fractal among flora.

Peacocks everyone is known for their colorful plumage, in which solid fractals are hidden.

Ice, frost patterns on the windows, these are also fractals

O  t enlarged image leaflet, before tree branches- you can find fractals in everything
Fractals are everywhere and everywhere in the nature around us. The entire universe is built according to surprisingly harmonious laws with mathematical precision. Is it possible after that to think that our planet is a random clutch of particles? Hardly.
Chapter 4
Fractals are finding more and more applications in science. The main reason for this is that they describe the real world sometimes even better than traditional physics or mathematics. Here are some examples:
O  days of the most powerful applications of fractals lie in computer graphics. This is fractal compression of images. Modern physics and mechanics are just beginning to study the behavior of fractal objects.
The advantages of fractal image compression algorithms are the very small size of the packed file and the short image recovery time. Fractally packed images can be scaled without the appearance of pixelization (poor image quality - large squares). But the compression process takes a long time and sometimes lasts for hours. The lossy fractal packing algorithm allows you to set the compression level, similar to the jpeg format. The algorithm is based on the search for large pieces of the image similar to some small pieces. And only which piece is similar to which is written to the output file. When compressing, a square grid is usually used (pieces are squares), which leads to a slight angularity when restoring the picture, a hexagonal grid is free from such a drawback.
Iterated has developed a new image format, "Sting", which combines fractal and "wave" (such as jpeg) lossless compression. The new format allows you to create images with the possibility of subsequent high-quality scaling, and the volume of graphic files is 15-20% of the volume of uncompressed images.
In mechanics and physics fractals are used due to the unique property to repeat the outlines of many natural objects. Fractals allow you to approximate trees, mountain surfaces, and fissures with higher accuracy than approximations with line segments or polygons (with the same amount of stored data). Fractal models, like natural objects, have "roughness", and this property is preserved at an arbitrarily large increase in the model. The presence of a uniform measure on fractals makes it possible to apply integration, potential theory, to use them instead of standard objects in the equations already studied.
T 
 Fractal geometry is also used to design of antenna devices. This was first used by American engineer Nathan Cohen, who then lived in the center of Boston, where the installation of external antennas on buildings was prohibited. Cohen cut out a Koch curve shape from aluminum foil and then pasted it onto a piece of paper before attaching it to a receiver. It turned out that such an antenna works no worse than a conventional one. And although physical principles such antennas have not been studied so far, this did not prevent Cohen from establishing his own company and setting up their serial production. At the moment, the American company “Fractal Antenna System” has developed a new type of antenna. Now you can stop using mobile phones protruding outdoor antennas. The so-called fractal antenna is located directly on the main board inside the device.
There are also many hypotheses about the use of fractals - for example, lymphatic and circulatory system, lungs and much more also have fractal properties.
Chapter 5. Practical work.
First, let's focus on the fractals "Necklace", "Victory" and "Square".
First - "Necklace"(Fig. 7). The circle is the initiator of this fractal. This circle consists of a certain number of the same circles, but of smaller sizes, and it itself is one of several circles that are the same, but of larger sizes. So the process of education is endless and it can be carried out both in one direction and in the opposite direction. Those. the figure can be enlarged by taking only one small arc, or it can be reduced by considering its construction from smaller ones.

rice. 7.
Fractal "Necklace"
The second fractal is "Victory"(Fig. 8). He got this name because it outwardly resembles the Latin letter “V”, that is, “victory”-victory. This fractal consists of a certain number of small “v”, which make up one large “V”, and in the left half, in which the small ones are placed so that their left halves make up one straight line, right part built the same way. Each of these "v" is built in the same way and continues this to infinity.

Fig.8. Fractal "Victory"
The third fractal is "Square" (Fig. 9). Each of its sides consists of one row of cells, shaped like squares, whose sides also represent rows of cells, and so on.

Fig. 9. Fractal "Square"
The fractal was called "Rose" (Fig. 10), due to its external resemblance to this flower. The construction of a fractal is associated with the construction of a series of concentric circles, the radius of which changes in proportion to a given ratio (in this case, R m / R b = ¾ = 0.75.). After that, a regular hexagon is inscribed in each circle, the side of which is equal to the radius of the circle described around it.


Rice. 11. Fractal "Rose *"
Next, we turn to the regular pentagon, in which we draw its diagonals. Then, in the pentagon obtained at the intersection of the corresponding segments, we again draw diagonals. Let's continue this process to infinity and get the "Pentagram" fractal (Fig. 12).
Let's introduce an element of creativity and our fractal will take the form of a more visual object (Fig. 13).

R  is. 12. Fractal "Pentagram".
Rice. 13. Fractal "Pentagram *"

Rice. 14 fractal "Black hole"
Experiment No. 1 "Tree"
Now that I understand what a fractal is and how to build one, I tried to create my own fractal images. In Adobe Photoshop, I created a small subroutine or action , the peculiarity of this action is that it repeats the actions that I do, and this is how I get a fractal.

To begin with, I created a background for our future fractal with a resolution of 600 by 600. Then I drew 3 lines on this background - the basis of our future fractal.


With The next step is to write the script.
duplicate layer ( layer > duplicate) and change the blend type to " Screen" .
Let's call him " fr1". Duplicate this layer (" fr1") 2 more times.
Now we need to switch to the last layer (fr3) and merge it twice with the previous one ( ctrl+e). Decrease layer brightness ( Image > Adjustments > Brightness/Contrast , brightness set 50% ). Again, merge with the previous layer and cut off the edges of the entire drawing to remove invisible parts.
As a final step, I copied this image and pasted it downsized and rotated. Here is the end result.

Conclusion
This work is an introduction to the world of fractals. We have considered only the smallest part of what fractals are, on the basis of what principles they are built.
Fractal graphics is not just a set of self-repeating images, it is a model of the structure and principle of any being. Our whole life is represented by fractals. All nature around us consists of them. It should be noted that fractals are widely used in computer games, where terrains are often fractal images based on three-dimensional models of complex sets. Fractals greatly facilitate the drawing of computer graphics; with the help of fractals, many special effects, various fabulous and incredible pictures, etc. are created. Also, with the help of fractal geometry, trees, clouds, coasts and all other nature are drawn. Fractal graphics are needed everywhere, and the development of "fractal technologies" is one of the most important tasks today.
In the future, I plan to learn how to build algebraic fractals when I study complex numbers in more detail. I also want to try to build my fractal image in the Pascal programming language using cycles.
It should be noted the use of fractals in computer technology, in addition to simply building beautiful images on a computer screen. Fractals in computer technology are used in the following areas:
1. Compress images and information
2. Hiding information in the image, in the sound, ...
3. Data encryption using fractal algorithms
4. Creating fractal music
5. System modeling
Not all areas are covered in our work. human knowledge where the theory of fractals found its application. We only want to say that no more than a third of a century has passed since the emergence of the theory, but during this time fractals for many researchers have become a sudden bright light in the night, which illuminated hitherto unknown facts and patterns in specific data areas. Using the theory of fractals, they began to explain the evolution of galaxies and the development of the cell, the emergence of mountains and the formation of clouds, the movement of prices on the stock exchange and the development of society and the family. Perhaps, at first, this passion for fractals was even too stormy and attempts to explain everything using the theory of fractals were unjustified. But, without a doubt, this theory has the right to exist, and we regret that recently it has somehow been forgotten and has remained the lot of the elite. In preparing this work, it was very interesting for us to find applications of THEORY in PRACTICE. Because very often there is a feeling that theoretical knowledge stands apart from the reality of life.
Thus, the concept of fractals becomes not only a part of "pure" science, but also an element of human culture. Fractal science is still very young and has a great future ahead of it. The beauty of fractals is far from being exhausted and will still give us many masterpieces - those that delight the eye, and those that bring true pleasure to the mind.
10. References
Bozhokin S.V., Parshin D.A. Fractals and multifractals. RHD 2001 .
Vitolin D. The use of fractals in computer graphics. // Computerworld-Russia.-1995
Mandelbrot B. Self-affine fractal sets, "Fractals in Physics". M.: Mir 1988
Mandelbrot B. Fractal geometry of nature. - M.: "Institute for Computer Research", 2002.
Morozov A.D. Introduction to the theory of fractals. Nizhny Novgorod: Nizhegorod Publishing House. university 1999
Paytgen H.-O., Richter P. H. The beauty of fractals. - M.: "Mir", 1993.
Internet resources
http://www.ghcube.com/fractals/determin.html
http://fractals.nsu.ru/fractals.chat.ru/
http://fractals.nsu.ru/animations.htm
http://www.cootey.com/fractals/index.html
http://fraktals.ucoz.ru/publ
http://sakva.narod.ru
http://rusnauka.narod.ru/lib/author/kosinov_n/12/
http://www.cnam.fr/fractals/
http://www.softlab.ntua.gr/mandel/
http://subscribe.ru/archive/job.education.maths/201005/06210524.html
 How to get started as a tutor?
 Distance learning English
 Regular and irregular English verbs